Estrategia de trading con stop loss dinámico según EMA

Descripción general
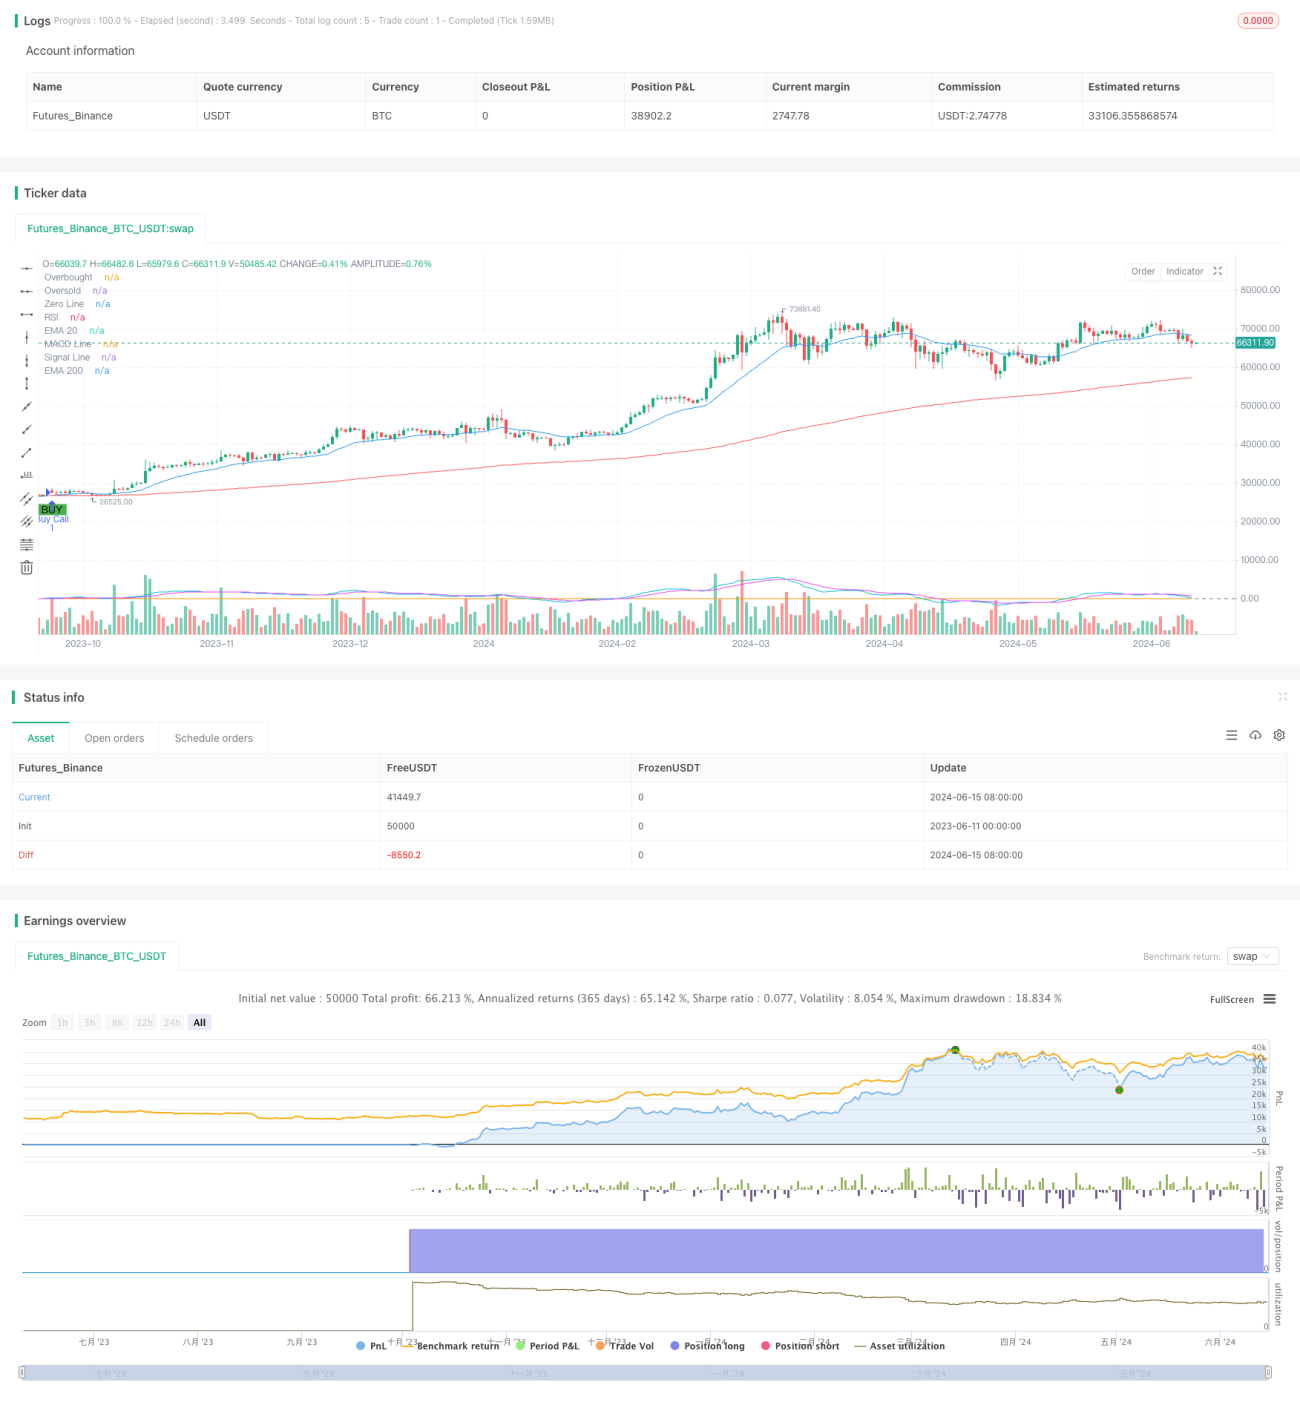
La estrategia se basa en señales cruzadas de las medias móviles de los índices de 20 días y 200 días (EMA) y se confirma en combinación con el indicador de dispersión de las medias móviles de convergencia (MACD) y el indicador de dispersión de las medias móviles de convergencia (RSI) para generar señales de compra y venta. Al mismo tiempo, la estrategia utiliza un método de stop loss dinámico y un objetivo fijo de ganancias para administrar el riesgo de negociación y bloquear los beneficios.
Principio de estrategia
- Calcula el EMA de 20 días y 200 días, cuando el EMA de 20 días sobrepasa el EMA de 200 días, genera una señal de compra; cuando el EMA de 20 días debajo atraviesa el EMA de 200 días, genera una señal de venta.
- El uso de RSI y MACD para confirmar la señal de cruce de EMA solo se ejecuta cuando el RSI es superior a 50 y la línea MACD es superior a la línea de señal; solo se ejecuta la venta cuando el RSI es inferior a 50 y la línea MACD es inferior a la línea de señal.
- Establezca un objetivo de rentabilidad fijo (por ejemplo, 20%) y un stop loss inicial (por ejemplo, 10%).
- Cuando el beneficio de la posición alcanza la rentabilidad objetivo, el precio de parada de pérdidas se eleva a menos del 10% del precio actual, para lograr una parada de pérdidas dinámica.
- Cuando el precio toca el precio de parada dinámica, la posición cerrada se cierra con ganancias.
Ventajas estratégicas
- La combinación de varios indicadores técnicos para confirmar la señal de transacción aumenta la fiabilidad de la señal.
- El método de stop loss dinámico, mientras se bloquean las ganancias, da un cierto margen de retroceso al precio y evita la liquidación prematura.
- El establecimiento de un objetivo fijo de rentabilidad ayuda a controlar el riesgo y lograr una rentabilidad estable.
Riesgo estratégico
- Las señales cruzadas de EMA pueden presentarse con frecuencia y falsas, lo que aumenta el costo de la operación.
- En un mercado convulso, la estrategia puede dar lugar a pérdidas continuas.
- Las tasas de rendimiento y de pérdidas fijas pueden no adaptarse a diferentes condiciones del mercado y deben ajustarse a la volatilidad del mercado.
Dirección de optimización de la estrategia
- Introducir más indicadores técnicos o de sentimiento de mercado para mejorar la precisión y fiabilidad de las señales.
- Utiliza tasas de rendimiento y de pérdidas objetivo adaptadas y se ajusta dinámicamente según la volatilidad del mercado y las características de los activos.
- La combinación de las tendencias del mercado y los ciclos de fluctuación, con diferentes configuraciones de parámetros en diferentes entornos de mercado.
Resumir
La estrategia, confirmada por la combinación de señales cruzadas de EMA con RSI y MACD, y el método de gestión de riesgos de stop loss dinámico y ganancias de objetivo fijo, promete obtener ganancias estables en un mercado de tendencia. Sin embargo, en un mercado de volatilidad, la estrategia puede enfrentar el riesgo de operaciones frecuentes y pérdidas continuas. Por lo tanto, se necesitan más optimizaciones y mejoras para mejorar la adaptabilidad y solidez de la estrategia.
- 1