Estrategia de negociación de cruce de medias móviles dobles con stop-profit y stop-loss dinámicos

Descripción general
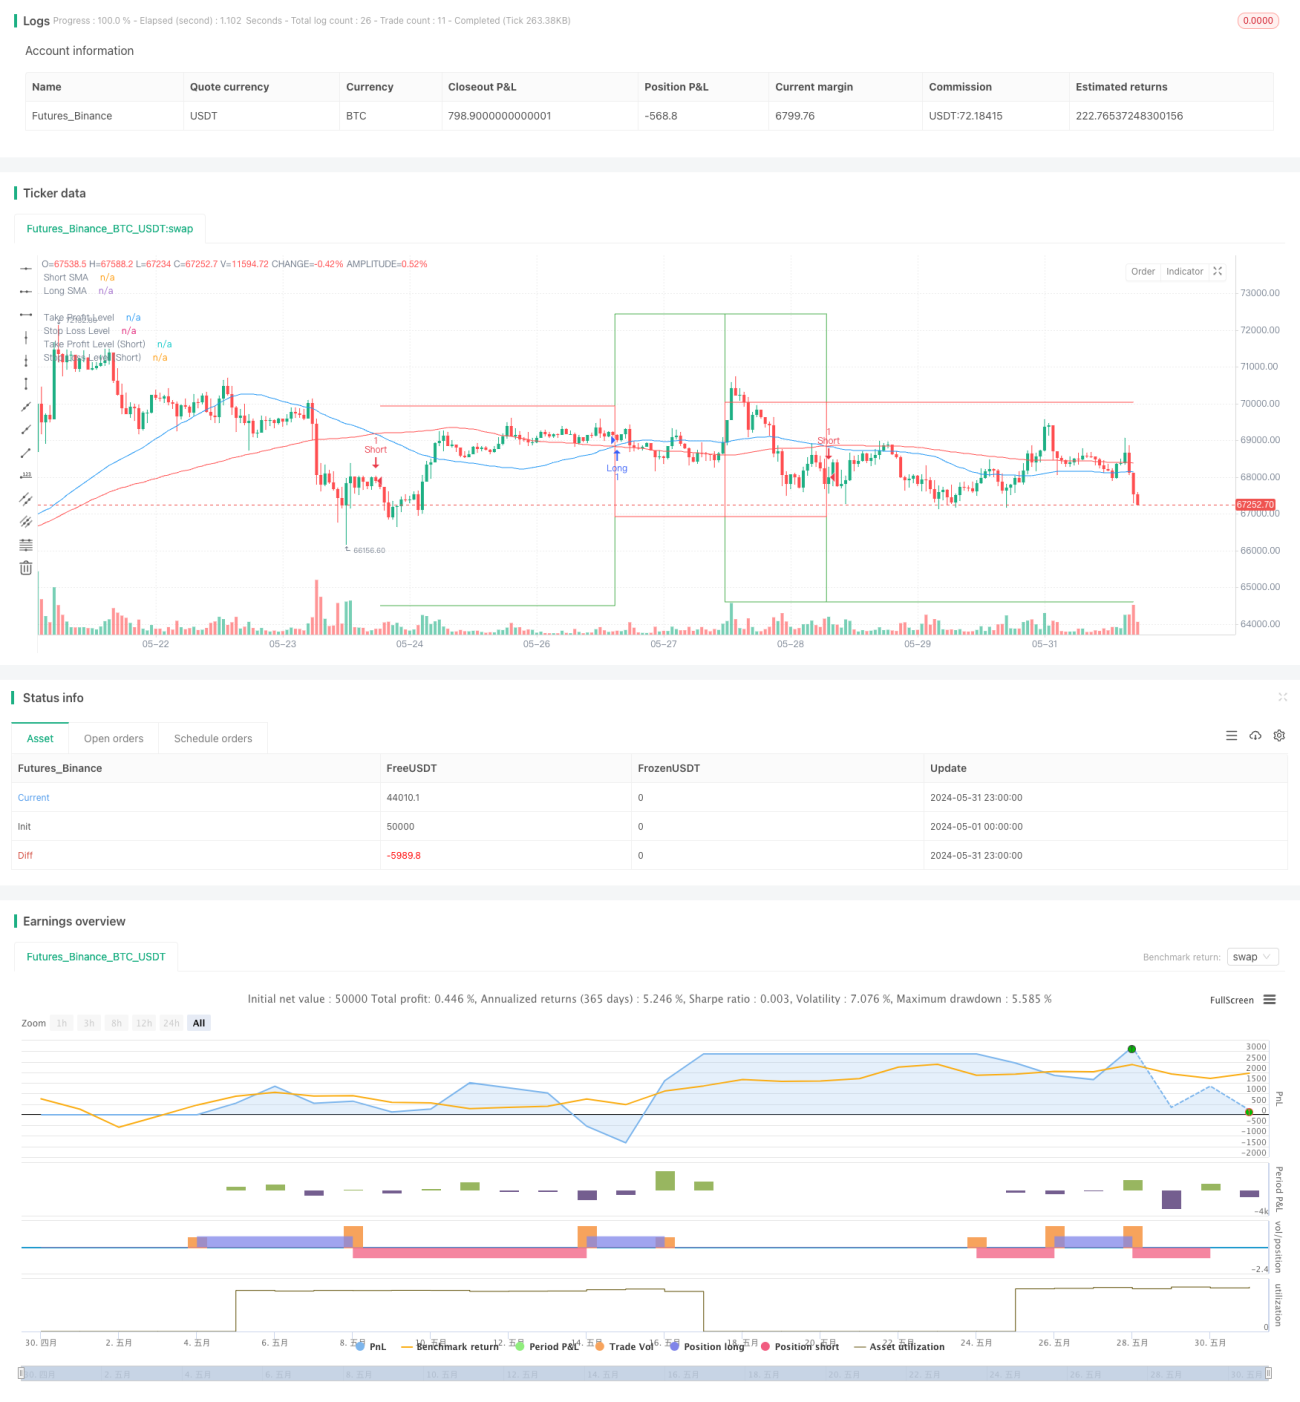
Esta estrategia es un sistema de negociación automática basado en cruces de medias móviles simples (SMA) combinadas con mecanismos dinámicos de stop y stop loss. Utiliza dos SMA de diferentes períodos para generar señales de compra y venta a través de su cruce. Al mismo tiempo, la estrategia también establece niveles de stop y stop basados en porcentajes para controlar el riesgo y bloquear los beneficios.
Principio de estrategia
- Se utilizan dos SMA: uno de corto plazo (de 50 ciclos) y otro de largo plazo (de 100 ciclos).
- Cuando el SMA corto lleva el SMA largo, genera una señal de compra; cuando el SMA corto lleva el SMA largo, genera una señal de venta.
- Cada vez que se abre una posición, se calculan los niveles de parada y pérdida en función del precio actual y el porcentaje predeterminado.
- Cuando el precio alcanza un nivel de stop-loss o stop-loss, se cierra automáticamente la posición.
- La estrategia marca las señales de compra y venta en el gráfico y traza las líneas horizontales de parada y pérdida.
Ventajas estratégicas
- Sencillo y fácil de entender: El cruce de dos líneas es un método clásico de análisis técnico que es fácil de entender e implementar.
- Seguimiento de tendencias: captura de tendencias a medio y largo plazo para obtener beneficios de las grandes tendencias.
- Gestión de riesgos: Control eficaz de los riesgos de cada operación mediante la configuración dinámica de stop loss.
- Automatización: todo el proceso es ejecutado por un programa, reduciendo la intervención humana y el impacto emocional.
- Visualización: señala claramente las señales de negociación y los precios clave en los gráficos para facilitar el análisis y la retroalimentación.
Riesgo estratégico
- No se aplica a los mercados convulsivos: en los mercados convulsivos horizontales puede generarse una señal falsa frecuente, lo que lleva a pérdidas continuas.
- Retraso: El SMA es retraso en sí mismo, puede perder el punto de entrada óptimo o retrasar la salida.
- Riesgo porcentual fijo: el uso de un stop loss porcentual fijo puede no ser adecuado para todas las condiciones del mercado.
- Falta de otros indicadores de confirmación: depender únicamente de la intersección lineal equidistante puede pasar por alto otra información importante del mercado.
- No se tienen en cuenta los costos de transacción: la frecuencia de las transacciones puede generar costos de transacción elevados que afectan a los ingresos finales.
Dirección de optimización de la estrategia
- Introducción de filtros: Se puede agregar el volumen de tráfico, la tasa de fluctuación u otros indicadores técnicos como condición de filtración para reducir las señales falsas.
- Ajuste dinámico del ciclo SMA: ajuste automático de la duración del SMA en función de la volatilidad del mercado para adaptarse a diferentes entornos de mercado.
- Optimización del Stop Loss: Considere el uso de ATR (Average True Range) para establecer niveles de Stop Loss dinámicos y adaptarse mejor a la volatilidad del mercado.
- Aumento de la confirmación de tendencias: en combinación con otros indicadores de tendencias como MACD o ADX, mejora la fiabilidad de las señales de negociación.
- Adjunta de gestión de posiciones: el tamaño de las posiciones de cada transacción se ajusta en función del tamaño de la cuenta y la dinámica de la volatilidad del mercado.
- Filtrado por tiempo: aumenta la ventana de tiempo de negociación para evitar períodos de gran volatilidad o poca liquidez.
- Control de retiro: agregar un límite máximo de retiro y suspender el comercio cuando los pérdidas continuas alcanzan un cierto nivel.
Resumir
Esta estrategia de negociación basada en el cruce de dos líneas equiláreas ofrece un marco simple y eficaz para los principiantes en la automatización de la negociación. Combina elementos de seguimiento de tendencias y gestión de riesgos para proteger los fondos mediante el establecimiento dinámico de stop-loss. Sin embargo, para obtener mejores resultados en el comercio real, se requiere una optimización y perfección adicional. Se puede considerar la adición de más indicadores técnicos como filtros, la optimización de los métodos de establecimiento de stop-loss, y la introducción de una estrategia de gestión de posición más compleja.
/*backtest
start: 2024-05-01 00:00:00
end: 2024-05-31 23:59:59
period: 1h
basePeriod: 15m
exchanges: [{"eid":"Futures_Binance","currency":"BTC_USDT"}]
*/

// This Pine Script™ code is subject to the terms of the Mozilla Public License 2.0 at https://mozilla.org/MPL/2.0/
// © Pubgentleman

//@version=5- 1