Estrategia avanzada de cruce de EMA: sistema de trading adaptativo basado en objetivos dinámicos de stop loss y ganancias

Descripción general
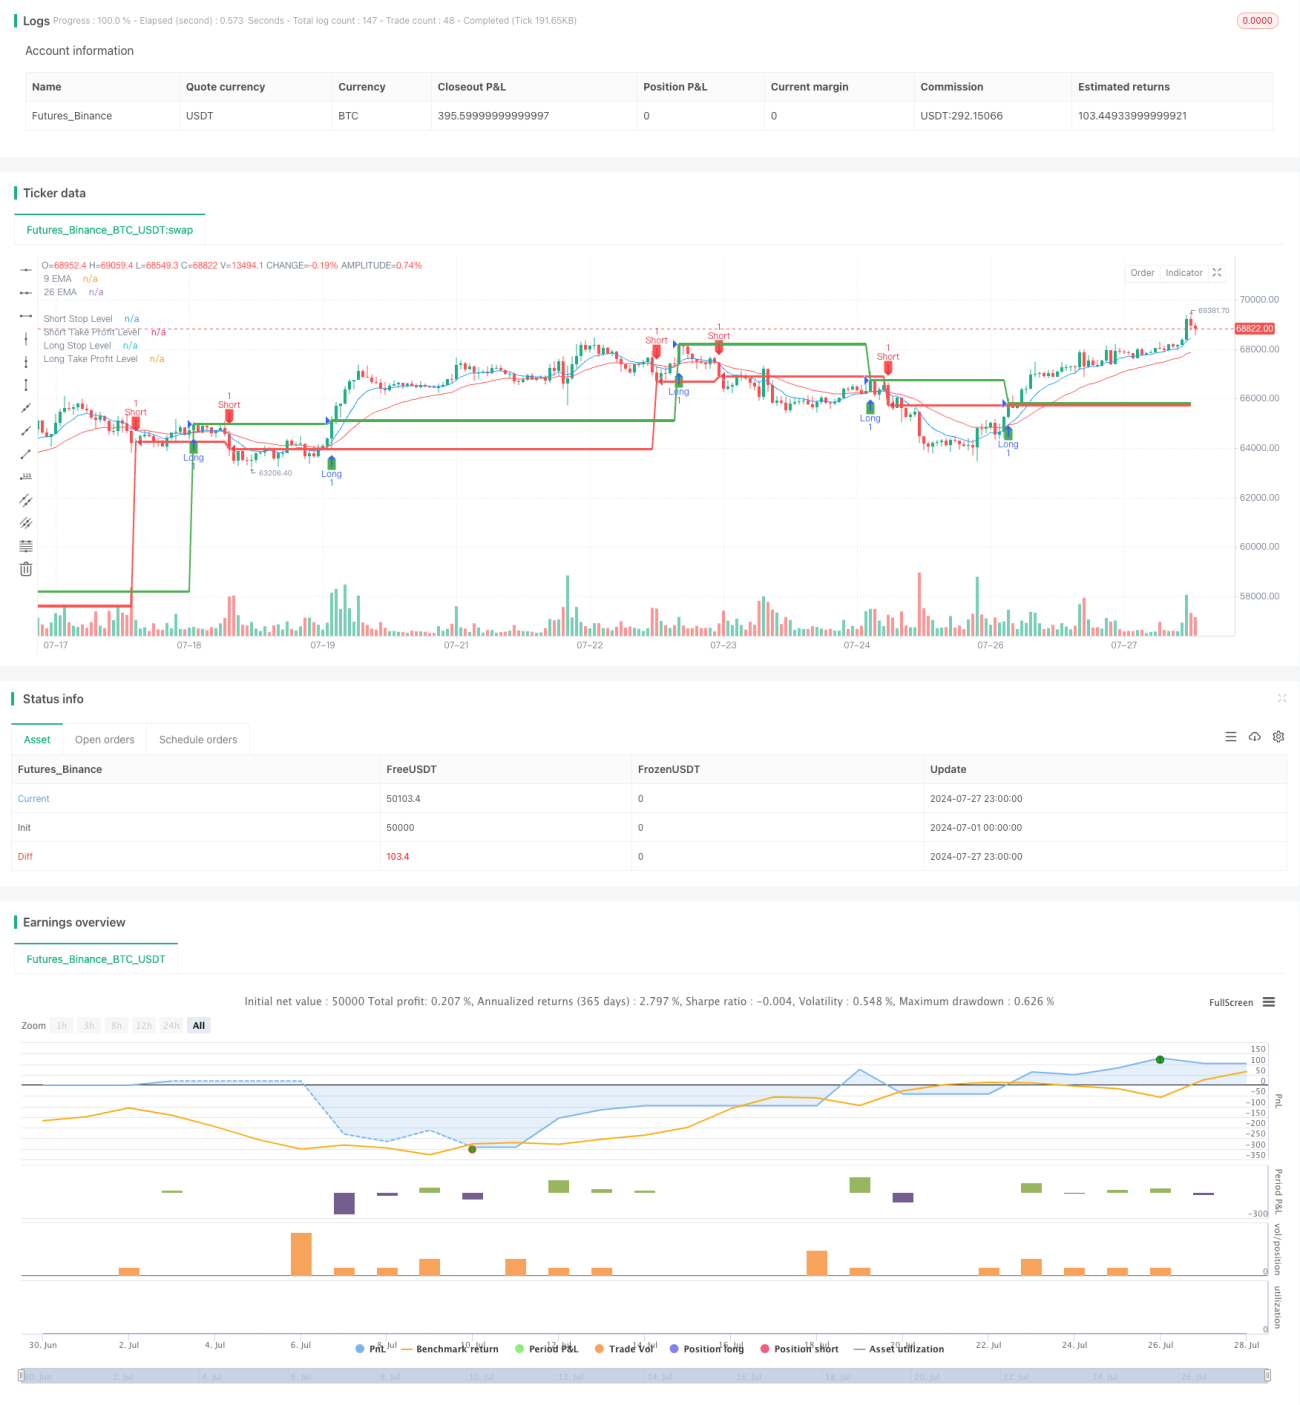
Esta estrategia de cruce de EMA avanzada es un sistema de negociación auto-adaptativo que utiliza cruces de EMA para generar señales de negociación. La estrategia combina EMA de 9 y 26 ciclos, que desencadenan señales de compra y venta cuando se cruzan. La estrategia es única porque introduce objetivos fijos de stop loss y recaudación de ganancias para administrar el riesgo y bloquear las ganancias.
Principio de estrategia
El núcleo de la estrategia es el uso de la intersección de los dos EMA para determinar la tendencia del mercado.
- Utiliza EMA de 9 y 26 ciclos como indicadores principales.
- Cuando el 9EMA atraviesa el 26EMA desde abajo, se activa la señal de compra.
- Cuando el 9EMA cruza el 26EMA desde arriba, se dispara la señal de venta.
- Cada transacción tiene un objetivo fijo de stop loss y ganancias, calculado en ticks.
- El stop loss para la compra está 90 ticks por debajo del precio de entrada, y el profit target está 270 ticks por encima del precio de entrada.
- El stop loss para la venta está 90 ticks por encima del precio de entrada y el profit target está 270 ticks por debajo del precio de entrada.
- Trazar las líneas EMA, las señales de negociación, los niveles de pérdida y ganancia en un gráfico para un análisis intuitivo.
- Configuración de la función de alerta para notificar a los operadores cuando se produce un cruce de EMA.
Ventajas estratégicas
- Seguimiento de tendencias: utiliza EMA para capturar las tendencias del mercado, lo que ayuda a negociar en el sentido contrario.
- Gestión de riesgos: los objetivos fijos de stop loss y de ganancias ayudan a controlar los riesgos y los beneficios potenciales de cada operación.
- Visualización: Muestra claramente las señales y los niveles de precios clave en un gráfico para facilitar el análisis y la toma de decisiones.
- Automatización: Las estrategias pueden ejecutar transacciones automáticamente, reduciendo la intervención humana y el impacto emocional.
- Flexibilidad: Se pueden ajustar los parámetros de EMA y la configuración de stop loss / profit en función de diferentes mercados y marcos de tiempo.
- Alertas en tiempo real: ayudan a los operadores a aprovechar las oportunidades de mercado a tiempo y a reaccionar más rápido.
Riesgo estratégico
- Exceso de operaciones: En un mercado convulso, los EMA pueden cruzarse con frecuencia, lo que genera demasiadas señales falsas.
- Retraso: El EMA es un indicador retrasado por naturaleza y puede reaccionar más lentamente cuando la tendencia se invierte.
- Detención fija / ganancias: en mercados con mucha volatilidad, el detenerse fijo puede ser demasiado pequeño, mientras que el objetivo de ganancias puede ser demasiado grande.
- Falta de identificación del entorno del mercado: la estrategia no considera el entorno general del mercado y puede operar en condiciones de mercado inadecuadas.
- Dependencia de un solo indicador: depender únicamente del cruce de EMA puede pasar por alto otra información importante del mercado.
Dirección de optimización de la estrategia
- Objetivos de pérdidas y ganancias dinámicas: Considere el uso de ATR para ajustar dinámicamente los niveles de pérdidas y ganancias para adaptarse a la volatilidad del mercado.
- Aumentar las condiciones de filtración: Introducir otros indicadores técnicos (como el RSI o el MACD) como señales de confirmación para reducir las falsas brechas.
- Identificación del entorno del mercado: añade indicadores de intensidad de tendencia (como el ADX) para ejecutar operaciones en mercados de fuerte tendencia.
- Análisis de múltiples marcos de tiempo: en combinación con marcos de tiempo más largos para confirmar la dirección de la tendencia general.
- Gestión de posiciones: Implementación de paradas parciales y funciones de acumulación para optimizar la gestión de fondos.
- Retroalimentación y optimización: realiza una revisión completa de diferentes combinaciones de parámetros para encontrar la configuración óptima.
- Aumentar el filtro de volumen de transacciones: evitar operaciones en períodos de bajo volumen de transacciones, reduciendo el riesgo de puntos de deslizamiento y falsas rupturas.
Resumir
Esta estrategia avanzada de cruce de EMA ofrece un marco simple y eficaz para capturar las tendencias del mercado y gestionar el riesgo. Combinando las señales de cruce de EMA, los parámetros fijos de gestión de riesgos y las alertas en tiempo real, la estrategia ofrece a los operadores un sistema de negociación completo. Sin embargo, para obtener mejores resultados en el comercio real, se recomienda una optimización y prueba adicionales.
- 1