Estrategia de negociación bidireccional con ruptura de gran volatilidad: sistema de entrada en corto y largo basado en un umbral de puntos

Descripción general
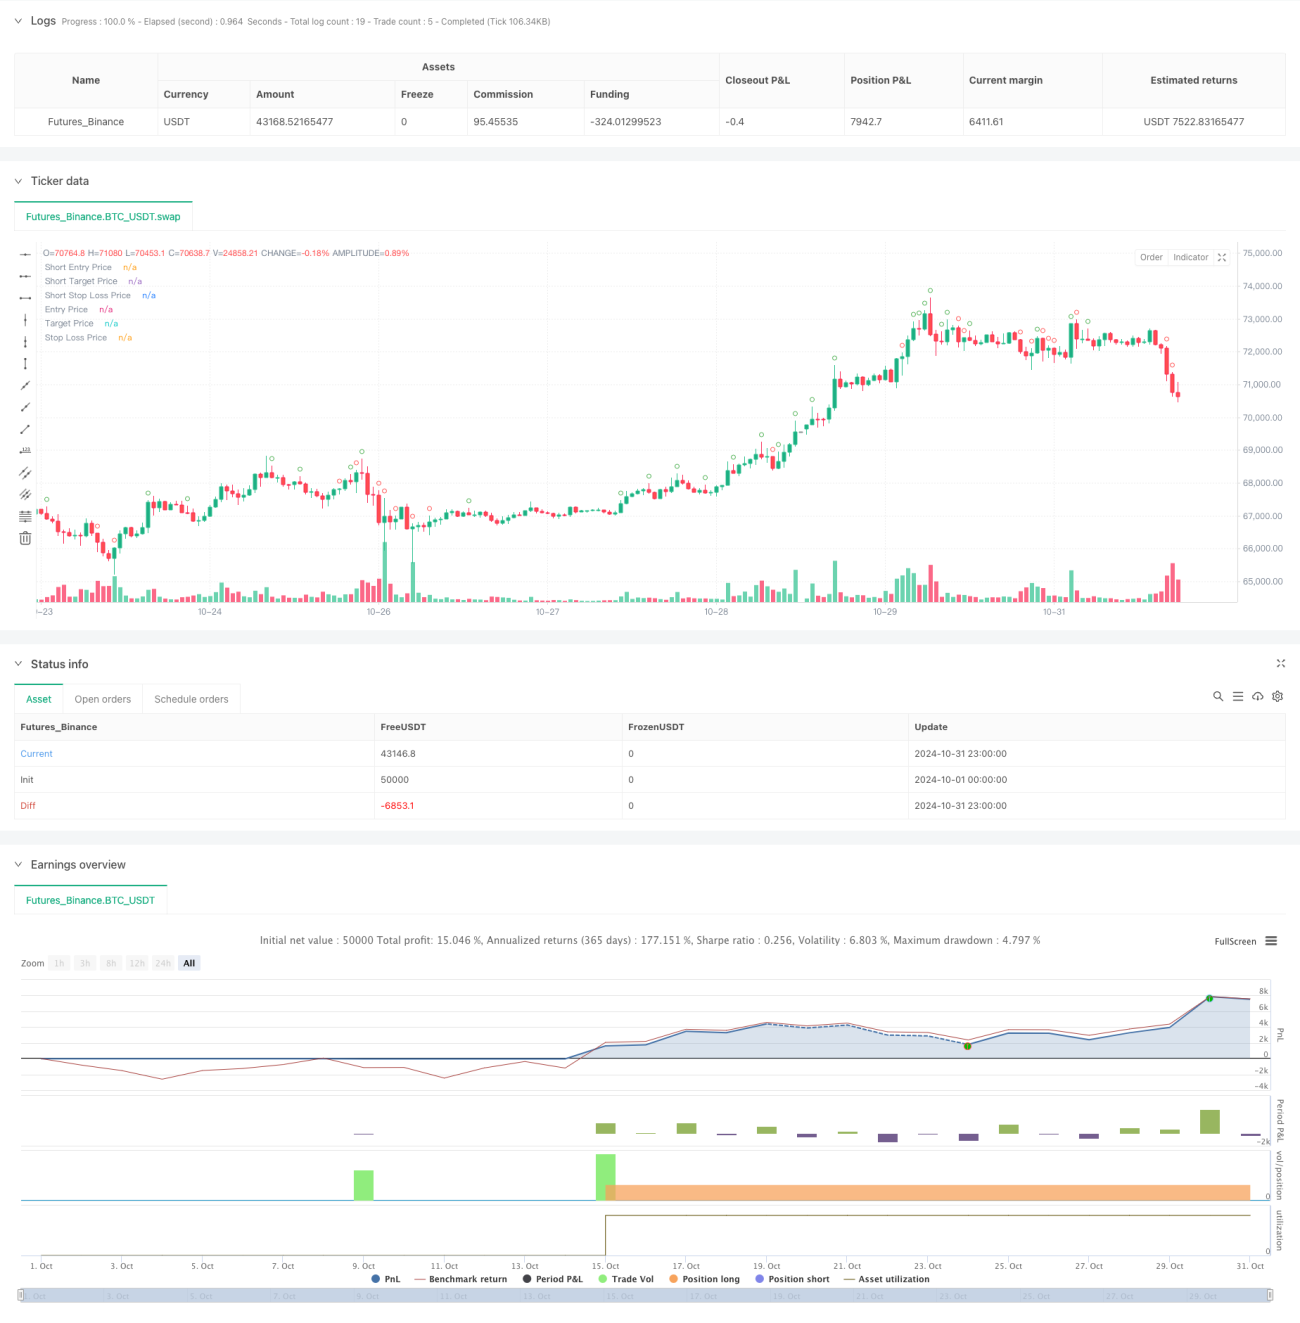
La estrategia es un sistema de negociación bidireccional basado en la línea K de 30 minutos para buscar oportunidades de negociación mediante la vigilancia de la amplitud de la fluctuación de los precios. El núcleo de la estrategia es identificar las grandes fluctuaciones mediante el establecimiento de umbrales puntuales y realizar operaciones en la dirección correspondiente después de la confirmación de la ruptura. La estrategia contiene un estricto manejo de tiempo, stop loss y mecanismos de gestión de operaciones para lograr operaciones automatizadas con riesgos controlables.
Principio de estrategia
La estrategia utiliza un mecanismo de filtración múltiple para identificar las señales de negociación válidas. En primer lugar, la estrategia calcula el rango de fluctuación de la entidad en el cierre de la línea K cada 30 minutos, y cuando la amplitud de la fluctuación supera el umbral predeterminado, se marca como una oportunidad de negociación potencial. Para garantizar la efectividad de la operación, la estrategia establece un punto de amortiguamiento adicional, que solo se activa cuando el precio rompe esta zona de amortiguamiento.
Ventajas estratégicas
- Una buena gestión del tiempo: limitar las ventanas de tiempo de negociación y evitar falsas señales de tiempo inactivo
- Mecanismos de intercambio bidireccional: aprovechar las oportunidades bidireccionales del mercado para mejorar la eficiencia de la utilización de los fondos
- Control de riesgos perfeccionado: el uso de puntos fijos para evaluar y administrar los riesgos
- Alto grado de automatización: automatización de todo el proceso, desde la identificación de señales hasta la ejecución de transacciones, con menos intervención humana
- Ajuste de los parámetros: los parámetros clave se pueden ajustar para adaptarse a diferentes entornos del mercado
Riesgo estratégico
- Riesgo de brecha falsa: una brecha falsa puede ocurrir después de una gran oscilación, lo que lleva a una salida de pérdidas
- Sensibilidad de parámetros: la configuración incorrecta de los umbrales puede causar oportunidades perdidas o exceso de operaciones
- Dependencia del entorno del mercado: puede desencadenar un stop loss frecuente en un mercado convulso
- Efectos del punto de deslizamiento: durante una alta volatilidad, el precio de transacción real puede estar muy alejado del precio de la señal
- Riesgo de gestión de fondos: la ausencia de un mecanismo de gestión de posiciones puede conducir a una abertura de riesgo excesiva
Dirección de optimización de la estrategia
- Aumentar el filtro de tendencias: combina indicadores de tendencias con períodos más largos para mejorar la calidad de la señal
- Optimización de parámetros dinámicos: ajuste automático de los parámetros de pérdidas y pérdidas según la volatilidad del mercado
- Introducción de la confirmación de la entrega: aumento de las condiciones de filtración de la entrega y mejora de la confiabilidad de la ruptura
- Optimización del stop-loss: realiza un stop-loss dinámico para adaptarse a diferentes entornos del mercado
- Incorporar gestión de posiciones: ajustar posiciones de forma dinámica en función de la intensidad de las señales y la volatilidad del mercado
Resumir
Esta es una estrategia de comercio automatizado diseñada de forma completa y lógica. La estrategia tiene una buena practicidad a través de un estricto filtrado de condiciones y control de riesgos. Sin embargo, aún se necesita una prueba y optimización adecuadas en el entorno físico, especialmente en lo que respecta a la configuración de parámetros y el control de riesgos.
- 1