
Descripción general
Se trata de una estrategia de seguimiento de tendencias basada en el análisis de la forma de las bandas de Bollinger y los gráficos de fluctuación. La estrategia se basa en la observación de las características de la forma de fluctuación de los precios cuando tocan las bandas de Bollinger, combinadas con la relación de las tasas de las líneas ascendentes y descendentes para juzgar el posible punto de reversión del mercado.
Principio de estrategia
La lógica central de la estrategia se basa en los siguientes elementos clave: primero, determinar el alcance de la fluctuación de los precios mediante el cálculo de los bolígrafos de 20 ciclos; segundo, analizar la relación de la guía de arriba a abajo de la gráfica con la entidad cuando los precios tocan la banda de bolígrafos, que se considera una señal de reversión potencial cuando la relación supera el umbral establecido; tercero, establecer un punto de parada por medio del cálculo de los puntos clave de soporte y resistencia; y, finalmente, calcular la cantidad de posiciones en cada operación en función de una proporción fija del total de la cuenta (<1%) para lograr la gestión dinámica del riesgo. La estrategia también ofrece una variedad de opciones de entrada, incluidos los precios de cierre, apertura, máximo y mínimo del día, etc.
Ventajas estratégicas
- Control de riesgos preciso: Modelo de gestión de riesgos de proporción fija para asegurar que las aberturas de riesgo de cada operación estén dentro de un rango controlado
- Flexibilidad en el punto de entrada: ofrece varias opciones de precios de entrada para adaptarse a diferentes estilos de negociación
- Combinación de indicadores técnicos: combinación de las bandas de Bollinger con el análisis de las formas de los gráficos de proyección para mejorar la fiabilidad de la señal
- La configuración de stop loss es razonable: el stop loss se ajusta a las leyes de funcionamiento del mercado a través de la configuración de la resistencia de soporte clave
- Administración de transacciones perfecta: incluye un mecanismo de vencimiento de pedidos para evitar el error de la señal de vencimiento
Riesgo estratégico
- Riesgo de fluctuaciones rápidas en el mercado: las tasas de referencia pueden generar falsas señales en un mercado muy volátil
- Riesgo de gestión de fondos: el modelo de riesgo de proporción fija puede causar posiciones demasiado pequeñas en caso de pérdidas continuas
- Riesgo de la configuración de stop loss: el cálculo de los puntos de resistencia de soporte puede no ser lo suficientemente preciso en ciertas condiciones de mercado
- Dependencia del ciclo de tiempo: la estrategia se basa principalmente en el nivel de la línea de sol, lo que puede perder oportunidades en marcos de tiempo más pequeños
Dirección de optimización de la estrategia
- Introducción de indicadores de tráfico: se puede aumentar la fiabilidad de la señal mediante el aumento del análisis de tráfico en la confirmación de la señal
- Optimización del mecanismo de detención de pérdidas: Considere la introducción de detención dinámica, que ajuste automáticamente la distancia de detención de pérdidas según la volatilidad del mercado
- Aumentar el filtro de entornos de mercado: agregar indicadores de intensidad de tendencia y ajustar los parámetros de la estrategia en diferentes entornos de mercado
- Mejorar la gestión de posiciones: considerar la introducción de un mecanismo dinámico de gestión de posiciones, ajustando la apertura de riesgo en función de la volatilidad del mercado
- Aumentar el filtro de tiempo: se puede agregar un filtro de tiempo para evitar el comercio en momentos de mayor volatilidad del mercado
Resumir
La estrategia combina herramientas clásicas de análisis técnico con métodos modernos de gestión de riesgos para construir un sistema de negociación relativamente completo. Las ventajas centrales de la estrategia residen en su estricto control de riesgos y su mecanismo de entrada flexible, pero también en la necesidad de prestar atención a los cambios en el entorno del mercado y la verificación de la fiabilidad de las señales en su aplicación práctica.
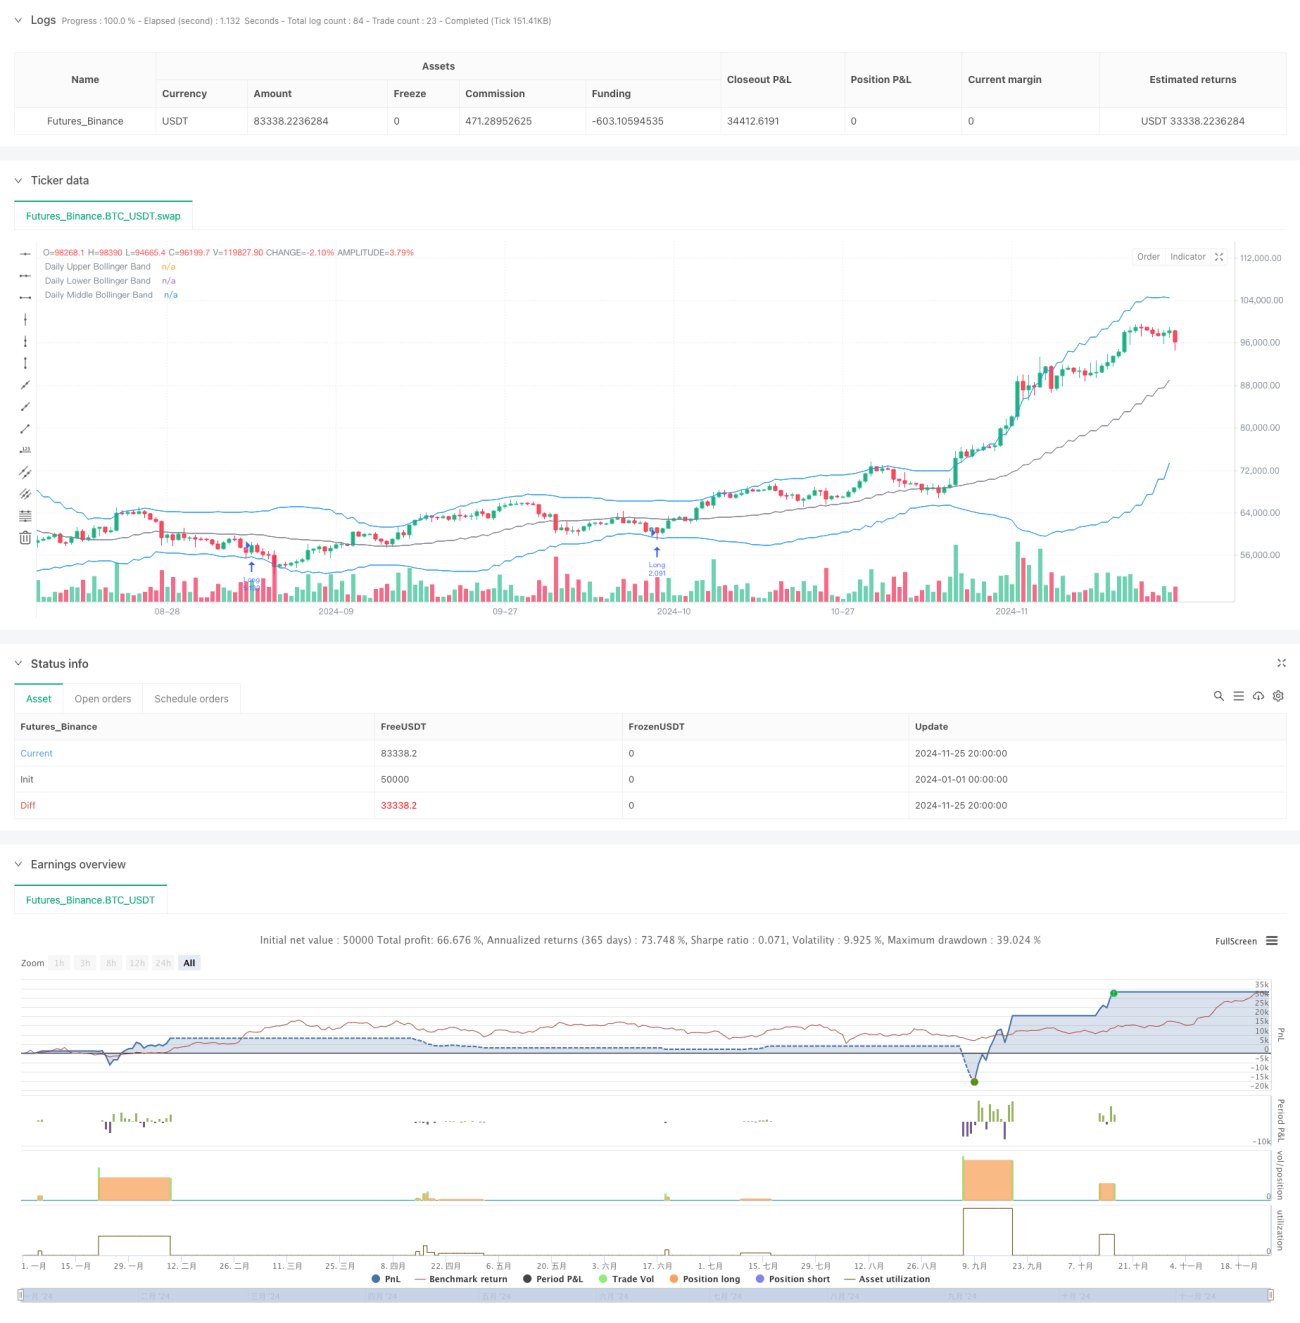
/*backtest
start: 2024-01-01 00:00:00
end: 2024-11-26 00:00:00
period: 12h
basePeriod: 12h
exchanges: [{"eid":"Futures_Binance","currency":"BTC_USDT"}]
*/

//@version=5
strategy("Trade Entry Detector, based on Wick to Body Ratio when price tests Bollinger Bands", overlay=true, default_qty_type=strategy.fixed)

// Input for primary analysis time frame- 1