Estrategia de trading dinámica basada en Z-score y supertendencia: sistema de cambio de posiciones largas a cortas

Descripción general
La estrategia es un sistema de comercio cuantitativo que combina el método estadístico Z-Score, el indicador RSI y el indicador Supertrend. La estrategia busca oportunidades de comercio de alta probabilidad en el mercado mediante la monitorización de la desviación estadística de los precios, la combinación de indicadores de dinámica y la confirmación de tendencias.
Principio de estrategia
La lógica central de la estrategia se basa en la sinergia de tres indicadores técnicos principales: primero, la medición de la desviación del precio actual con respecto a la media histórica mediante el cálculo de un Z-score en el precio, en el que se utilizan un promedio móvil y una diferencia estándar de 75 ciclos. Cuando el Z-score es superior a 1.1 o inferior a -1.1, se indica que el precio se ha desviado estadísticamente significativamente.
Ventajas estratégicas
- Confirmación de múltiples señales: mejora significativamente la fiabilidad de las señales de negociación mediante la combinación de indicadores en tres dimensiones: estadística, dinámica y tendencia.
- Adaptabilidad: El método de cálculo de la puntuación Z permite que la estrategia se adapte a diferentes entornos de mercado sin verse afectada por el nivel absoluto de precios.
- Control de riesgos mejorado: el indicador de tendencias súper proporciona un seguimiento automático de tendencias y un mecanismo de control de riesgos.
- Negociación bidireccional: La estrategia permite capturar oportunidades en las dos direcciones del espacio libre, mejorando la eficiencia de la utilización de los fondos.
- La claridad de la señal: la estrategia utiliza modelos matemáticos claros y indicadores objetivos, evitando juicios subjetivos.
Riesgo estratégico
- Riesgo de atraso: debido al uso de promedios móviles de varios períodos, la estrategia puede sufrir un retraso en la señal en mercados que cambian rápidamente.
- Riesgo de brechas falsas: En los mercados de discusión, las señales de brechas falsas pueden ser frecuentes.
- Sensibilidad de parámetros: la eficacia de la estrategia depende en gran medida de la elección de los parámetros, y diferentes entornos de mercado pueden requerir diferentes configuraciones de parámetros.
- Dependencia de las condiciones del mercado: En mercados donde no hay una tendencia clara, la estrategia puede no funcionar lo suficientemente bien.
Dirección de optimización de la estrategia
- Ajuste de parámetros dinámicos: Se puede introducir un mecanismo de parámetros adaptativos para ajustar automáticamente los parámetros de los mínimos de Z-score y las tendencias súper según la volatilidad del mercado.
- Aumentar el filtro de entornos de mercado: agregar el módulo de identificación de entornos de mercado para usar diferentes combinaciones de parámetros en diferentes condiciones de mercado.
- Mecanismos de detención de pérdidas: Introducción de estrategias de detención de pérdidas dinámicas, como la detención de pérdidas basadas en ATR o el seguimiento de las pérdidas.
- Filtración de la señal de optimización: Se puede agregar la confirmación de la transacción o otros indicadores técnicos para filtrar aún más las señales de transacción.
- Introducción de filtros de tiempo: Considere la posibilidad de incrementar las ventanas de tiempo de negociación para evitar períodos de mayor volatilidad.
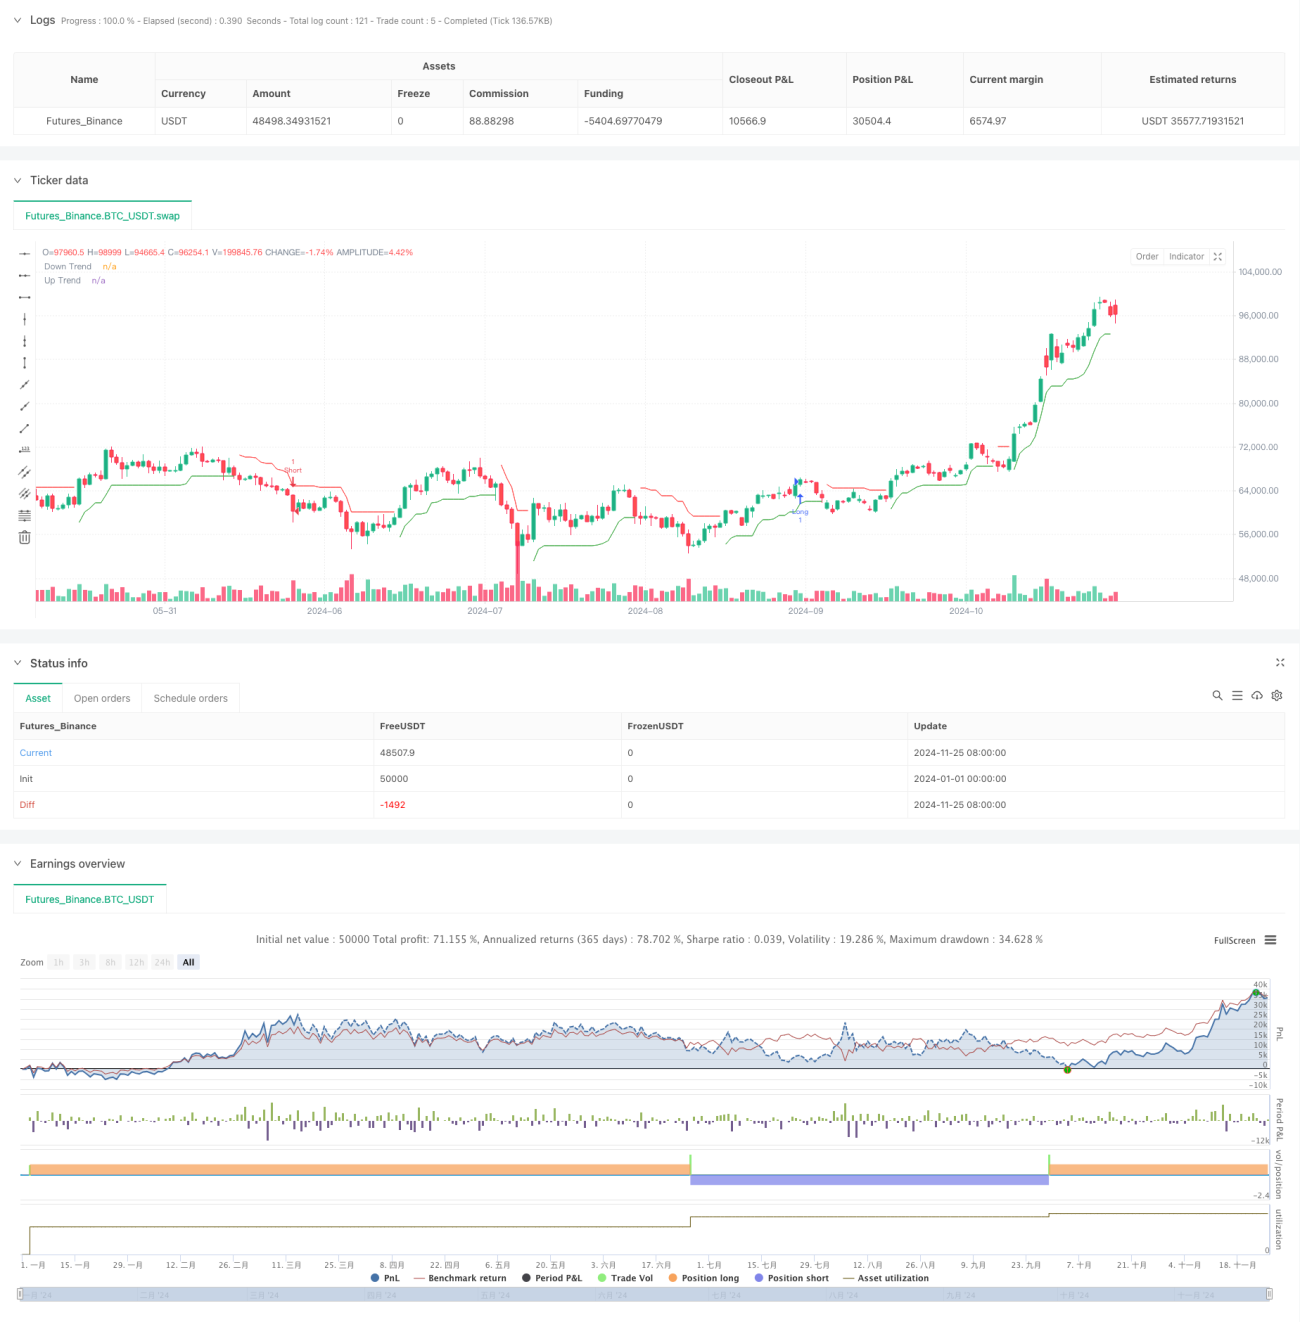
Resumir
Se trata de una estrategia de trading cuantitativa que combina métodos estadísticos y análisis técnico para mejorar la fiabilidad de las operaciones mediante la confirmación de múltiples señales. La ventaja central de la estrategia radica en su modelo matemático objetivo y su mecanismo de control de riesgos perfectos, pero al mismo tiempo se debe prestar atención a la optimización de los parámetros y a la adaptabilidad del mercado.
- 1