
Descripción general
La estrategia es un sistema de negociación avanzado que combina múltiples herramientas de análisis técnico para generar señales de negociación basadas principalmente en los niveles de retracción de Fibonacci de los marcos de tiempo más altos y las condiciones de ruptura de precios altos y bajos. La estrategia calcula dinámicamente los datos de precios de los marcos de tiempo más altos, combinando los niveles de retracción de Fibonacci y las condiciones de ruptura de precios personalizadas, para formar un sistema de decisión de negociación completo.
Principio de estrategia
La lógica central de la estrategia se basa en tres pilares principales: primero, el análisis de precios en un marco de tiempo más alto, la creación de una perspectiva más macro del mercado mediante el cálculo de precios de apertura y cierre en períodos de tiempo más altos, como la línea del día. Luego, el cálculo dinámico de los niveles de retroceso de Fibonacci, el establecimiento de los puntos de resistencia de soporte clave basados en el intervalo de precios en el marco de tiempo alto.
Ventajas estratégicas
- Análisis multidimensional: combina algunos de los elementos más reconocidos en el análisis técnico, incluido el comportamiento de los precios, el seguimiento de tendencias y la resistencia al soporte.
- Adaptabilidad: los parámetros se pueden ajustar en función de las diferentes condiciones del mercado, incluidos el ciclo de tiempo, el período de retroceso y los niveles de Fibonacci.
- Mejor gestión de riesgos: Reducción del riesgo de brechas falsas mediante mecanismos de confirmación múltiple.
- Alta visibilidad: todos los precios clave se ven claramente en el gráfico para facilitar la toma de decisiones comerciales.
- Flexible: Se puede aplicar a diferentes tipos de transacciones y períodos de tiempo.
Riesgo estratégico
- Sensibilidad de los parámetros: Diferentes ajustes de retraso pueden causar una gran diferencia en la calidad de la señal.
- Dependencia de las condiciones del mercado: puede haber demasiadas falsas señales en un mercado convulso.
- Riesgo de retraso: el uso de datos retrospectivos puede hacer que se pierda el mejor punto de entrada en un mercado rápido.
- Riesgo de optimización excesiva: la optimización excesiva de los parámetros puede causar un mal rendimiento en el futuro.
Dirección de optimización de la estrategia
- Se recomienda agregar indicadores como ATR o Bollinger Bandwidth para filtrar los períodos de baja volatilidad.
- Filtro de tendencia de integración: Se puede agregar un sistema lineal para confirmar la dirección de la tendencia general.
- Optimización del tiempo de entrada: puede combinarse con indicadores de dinámica como el RSI para mejorar el tiempo de entrada.
- Ajuste de parámetros dinámicos: introducción de un mecanismo de adaptación para ajustar automáticamente los parámetros según las condiciones del mercado.
- Control de riesgo mejorado: añade un objetivo de stop loss y ganancias dinámicas.
Resumir
Se trata de un sistema de negociación bien diseñado, que combina varias herramientas de análisis técnico clásico para crear una estrategia de negociación práctica con una base teórica. La mayor característica de esta estrategia es que puede proporcionar señales de negociación más fiables a través de un análisis multidimensional, mientras se mantiene la suficiente flexibilidad para adaptarse a diferentes entornos de mercado.
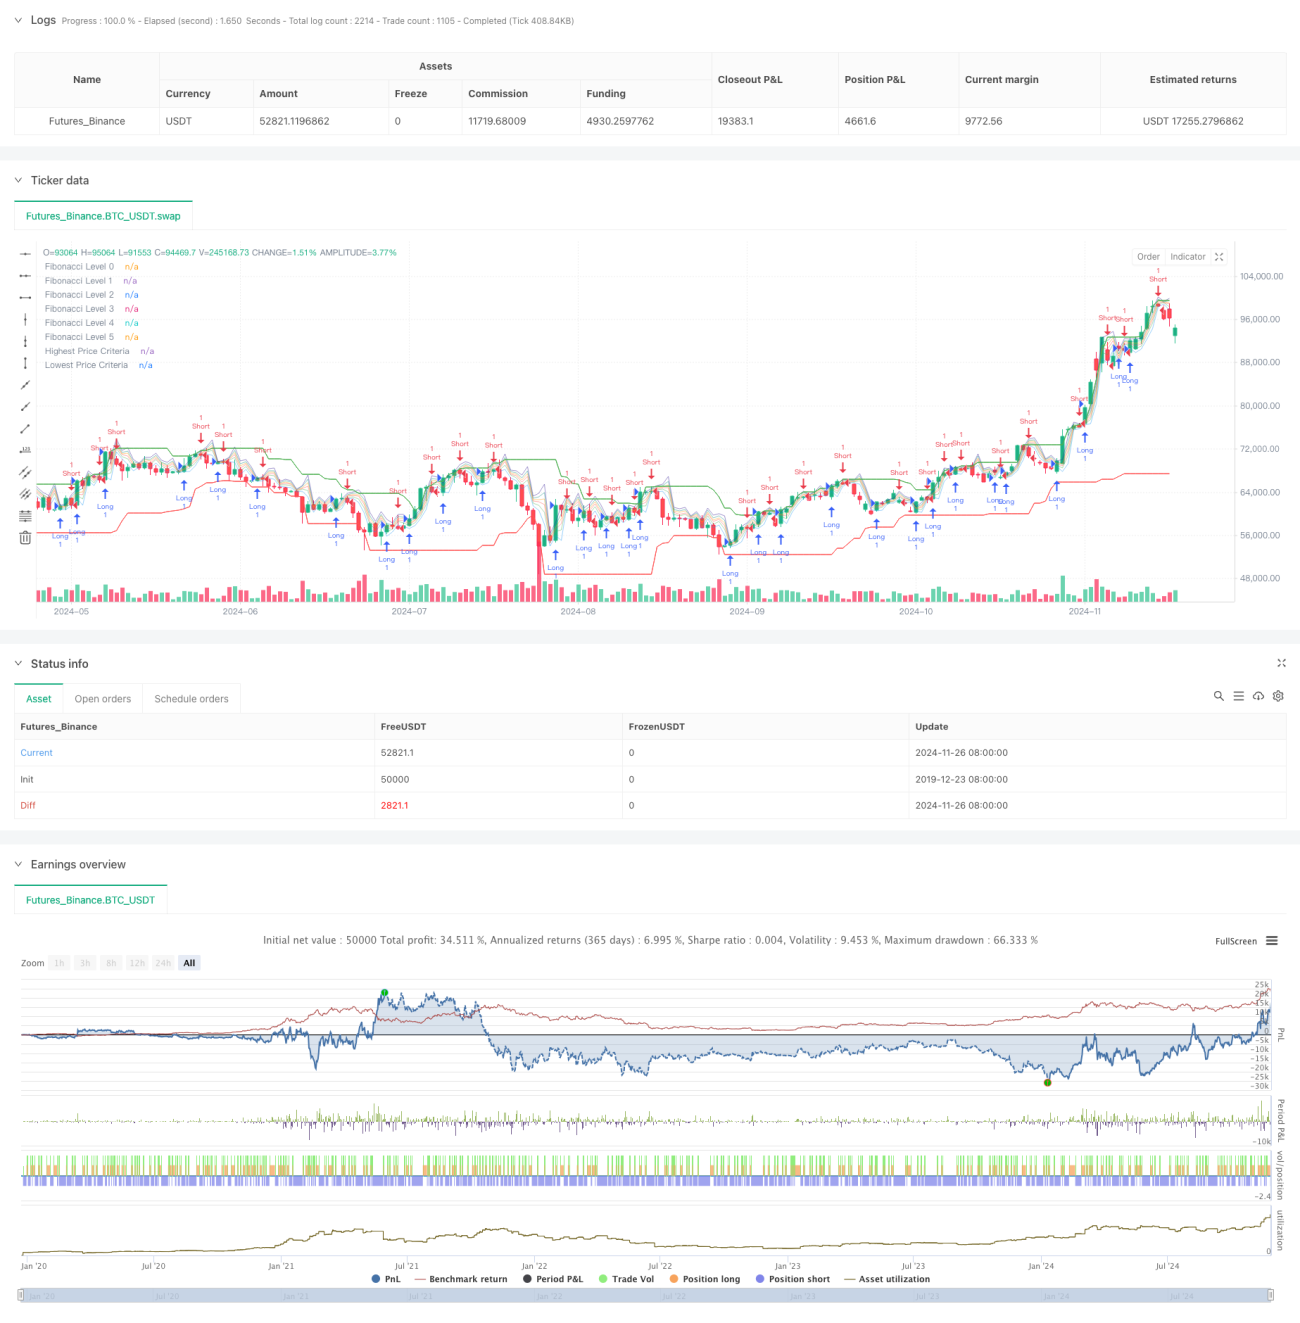
/*backtest
start: 2019-12-23 08:00:00
end: 2024-11-27 00:00:00
period: 1d
basePeriod: 1d
exchanges: [{"eid":"Futures_Binance","currency":"BTC_USDT"}]
*/

//@version=5
strategy("Fibonacci Levels Strategy with High/Low Criteria", overlay = true)

// Kullanıcıdan yüksek zaman dilimini ve mum bilgilerini al- 1