
Descripción general
La estrategia es un sistema de negociación integral basado en múltiples indicadores técnicos, que captura las tendencias del mercado y las oportunidades de reversión mediante la combinación de varios indicadores técnicos, como MACD, RSI, Bollinger Bands y ATR. La estrategia utiliza un programa de pérdidas y ganancias dinámico, capaz de ajustar los parámetros de negociación de acuerdo con la volatilidad del mercado, controlando el riesgo de manera efectiva mientras se garantiza la ganancia.
Principio de estrategia
La estrategia adopta un sistema de verificación de indicadores técnicos en varias capas, que incluye:
- El MACD ((12,26,9) se utiliza para capturar señales de conversión de movimiento, generando una señal de compra cuando el MACD pasa por la línea de señal y una señal de venta cuando pasa por ella
- RSI ((14) como un filtro secundario, por debajo de 35 se considera una zona de sobreventa, por encima de 65 se considera una zona de sobreventa
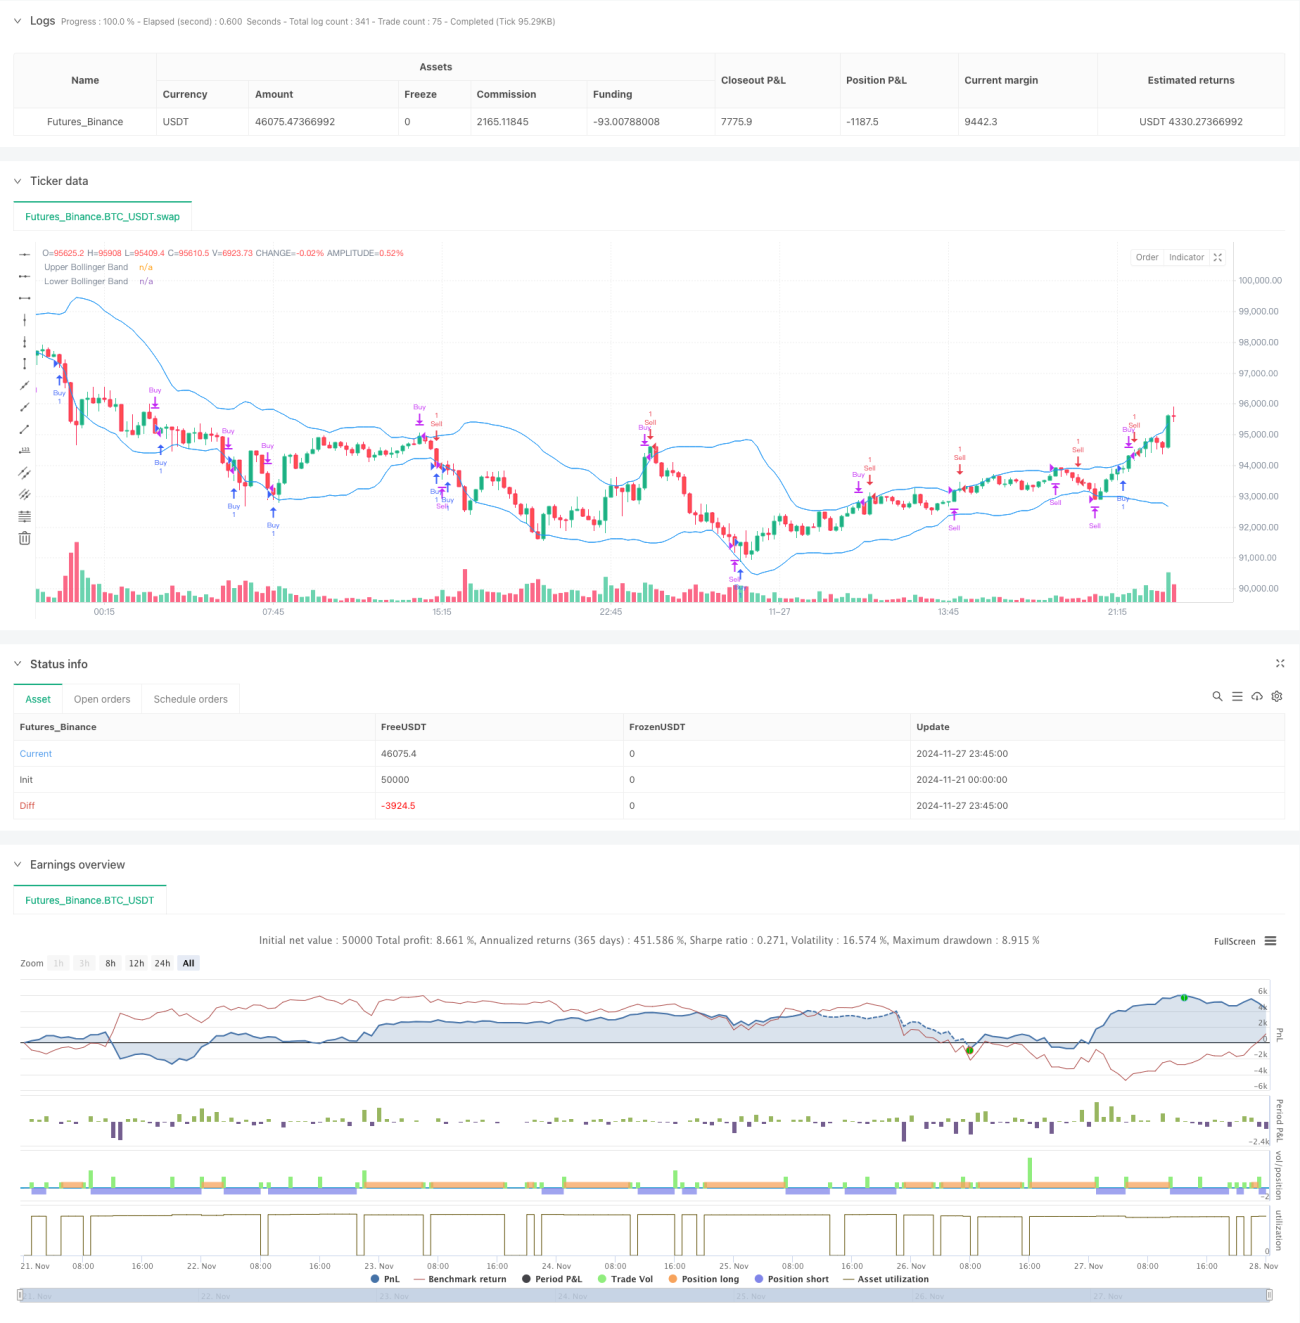
- Las bandas de Brin ((20, 2) se utilizan para identificar el rango de fluctuación de los precios, consideran comprar cuando el precio toca la vía baja y consideran vender cuando toca la vía alta
- ATR se utiliza para establecer dinámicamente los niveles de pérdidas y ganancias, con un límite de pérdidas de 3 veces ATR y un objetivo de ganancias de 5 veces ATR
La lógica de negociación combina las dos estrategias de seguimiento de tendencias y negociación inversa, para mejorar la precisión de las operaciones mediante la verificación múltiple. El sistema ajusta automáticamente los niveles de stop loss y ganancias en función de la volatilidad del mercado en tiempo real, lo que permite la optimización dinámica de la gestión de riesgos.
Ventajas estratégicas
- El sistema de verificación de señales multidimensionales mejora la fiabilidad de las transacciones
- Las estrategias de stop loss y profit dinámicas se adaptan a diferentes entornos de mercado
- La integración de las dos ideas de negociación, tendencia y reversión, aumenta las oportunidades de negociación
- Los sistemas automatizados de gestión de riesgos reducen el error de juicio humano
- El 53.99% de ganancias y un factor de ganancias de 1.44 muestran que la estrategia es estable
- Las estrategias de apoyo al comercio en tiempo real recordatorios para facilitar la operación de los comerciantes
Riesgo estratégico
- La multiplicación de indicadores puede causar un retraso en las señales y perder oportunidades en mercados rápidos.
- El retiro máximo del 56.33% requiere una mayor capacidad de asumir riesgos.
- Las transacciones frecuentes pueden generar costos de transacción más altos
- Las estrategias pueden tener mayores riesgos en mercados con fuertes fluctuaciones
Sugerencias para el control de riesgos:
- Implementar rigurosamente el plan de gestión de fondos
- Revisar y ajustar los parámetros periódicamente
- Suspensión de las operaciones durante la publicación de datos importantes
- Establezca un límite máximo de pérdidas por día
Dirección de optimización de la estrategia
-
Optimización de parámetros:
- Parámetros indicadores para considerar el uso de ciclos de adaptación
- Optimización de la configuración de los factores ATR para mejorar la relación riesgo-beneficio
-
Mejoras en el sistema de señalización:
- Adición de la verificación de los indicadores de la transacción
- Introducción de un indicador de la emoción en el mercado
-
Optimización de la gestión de riesgos:
- Realizar una gestión dinámica de posiciones
- Aumentar el filtro de tiempo
-
Mejoras tecnológicas:
- Agrega un filtro de fluctuaciones del mercado
- Optimización del tiempo de entrada y salida
Resumir
La estrategia logra un buen rendimiento comercial a través de una combinación de indicadores técnicos múltiples y un sistema de gestión de riesgos dinámico. Aunque existe un cierto riesgo de retroceso, la estrategia muestra una buena adaptabilidad y estabilidad al mercado a través de un estricto control de riesgos y una optimización continua. Se recomienda a los operadores que usen la estrategia que apliquen estrictamente el sistema de gestión de riesgos y ajusten los parámetros de acuerdo con los cambios en el mercado.
- 1