
Descripción general
Esta estrategia es un sistema de comercio cuantitativo que combina el cruce de promedios móviles y un índice relativamente fuerte (RSI) y integra la función de seguimiento de las paradas. La estrategia utiliza dos promedios móviles de 9 y 21 períodos como indicadores principales para juzgar la tendencia, junto con el indicador RSI para la confirmación de la señal de negociación y para proteger los beneficios y controlar el riesgo mediante el seguimiento dinámico de las paradas.
Principio de estrategia
La lógica central de la estrategia se basa en los siguientes elementos clave:
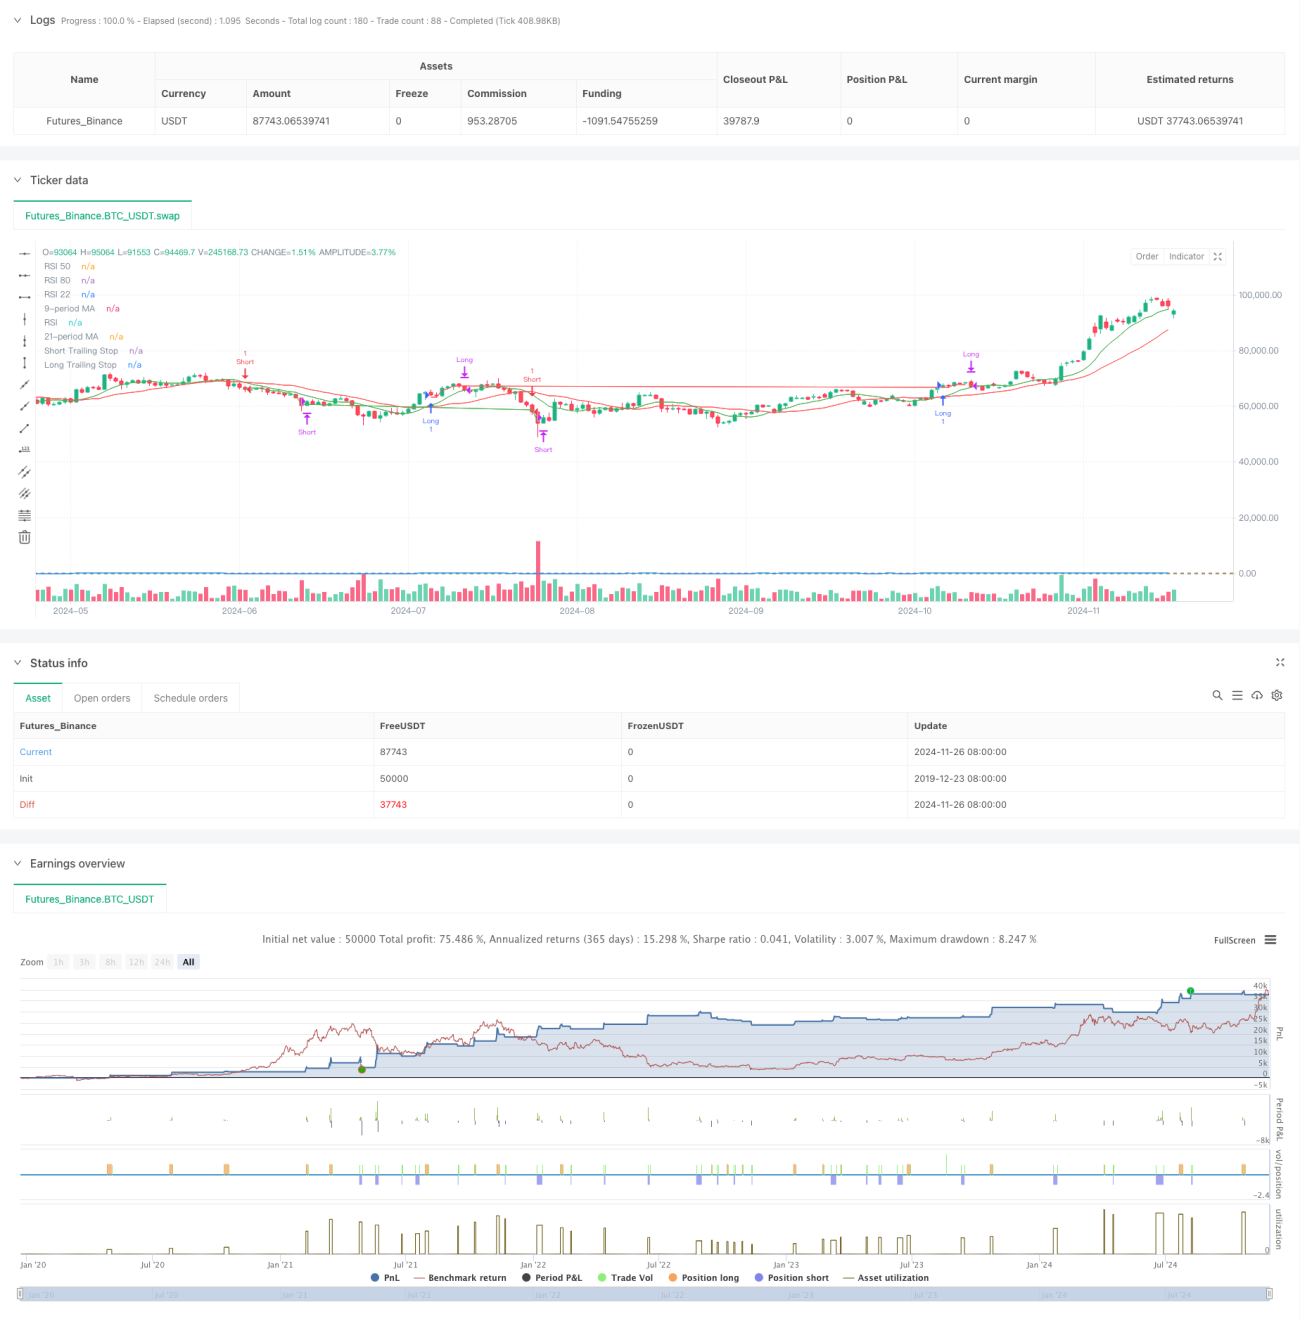
- Identificación de tendencias: Identificar los cambios en la tendencia del mercado a través de la cruz de las medias móviles rápidas (de 9 ciclos) y lentas (de 21 ciclos). Cuando la línea rápida atraviesa la línea lenta y el RSI es mayor que 55, produce una señal de más; Cuando la línea rápida atraviesa la línea lenta y el RSI es menor que 45, produce una señal de vacío.
- Confirmación de señales: utiliza el RSI como filtro de señales para mejorar la fiabilidad de las señales de negociación al establecer el umbral RSI.
- Control de riesgo: Se utiliza un 1% de seguimiento de la pérdida, y se ajusta dinámicamente la posición de la pérdida para proteger la ganancia. Al mismo tiempo, se establecen condiciones de cierre de ganancias basadas en el RSI, con posiciones excedentes y vacantes cuando el RSI es superior a 80 o inferior a 22, respectivamente.
- Mecanismo de detención de pérdidas: Combinado con un stop fijo y un stop de seguimiento, se elimina automáticamente la posición cuando el precio supera el porcentaje predeterminado del punto de entrada o toca la línea de detención de seguimiento.
Ventajas estratégicas
- Validación de señales multidimensionales: mejora la precisión de las señales de negociación mediante la doble confirmación de cruce de línea media y RSI.
- Una buena gestión de riesgos: el uso de un seguimiento dinámico de pérdidas para proteger los beneficios y controlar los riesgos.
- Flexible mecanismo de entrada: combina tendencias con indicadores de dinámica para capturar con eficacia los puntos de inflexión del mercado.
- Alto grado de automatización: La lógica de la estrategia es clara y fácil de automatizar.
- Adaptabilidad: adaptabilidad a diferentes entornos de mercado mediante ajustes de parámetros.
Riesgo estratégico
- Riesgo de mercado en movimiento: Falsa señal de ruptura puede ocurrir con frecuencia en mercados en movimiento horizontal.
- Riesgo de deslizamiento: Se puede enfrentar pérdida de puntos de deslizamiento en el proceso de ejecución de seguimiento de los paros.
- Sensibilidad de los parámetros: los ajustes de los períodos de la línea media y los mínimos del RSI tienen un gran impacto en el rendimiento de la estrategia.
- Riesgo sistémico: en casos extremos, el stop loss puede no ser ejecutado a tiempo.
Dirección de optimización de la estrategia
- Optimización de la señal: Se puede introducir un indicador de volumen de tránsito como condición complementaria para la confirmación de la señal.
- Optimización de la pérdida: Considere el mecanismo de ajuste dinámico de la proporción de pérdida basada en la volatilidad.
- Gestión de posiciones: añadido un sistema de gestión de posiciones dinámico basado en la evaluación de riesgos.
- Adaptabilidad al mercado: añade mecanismos de identificación del entorno del mercado, usando diferentes configuraciones de parámetros en diferentes estados del mercado.
- Filtración de señales: Se puede agregar un filtro de tiempo para evitar el comercio en los momentos de fluctuación antes de la apertura y el cierre del mercado.
Resumir
La estrategia combina los indicadores clásicos del análisis técnico para construir un sistema de negociación con características de seguimiento de tendencias y dinámicas. Su principal ventaja reside en el mecanismo de confirmación de señales multidimensional y el sistema de gestión de riesgos completo. A través de la optimización y mejora continuas, la estrategia espera mantener un rendimiento estable en diferentes entornos de mercado.
- 1