Sistema de trading de seguimiento de media móvil de impulso híbrido de doble cadena

Descripción general
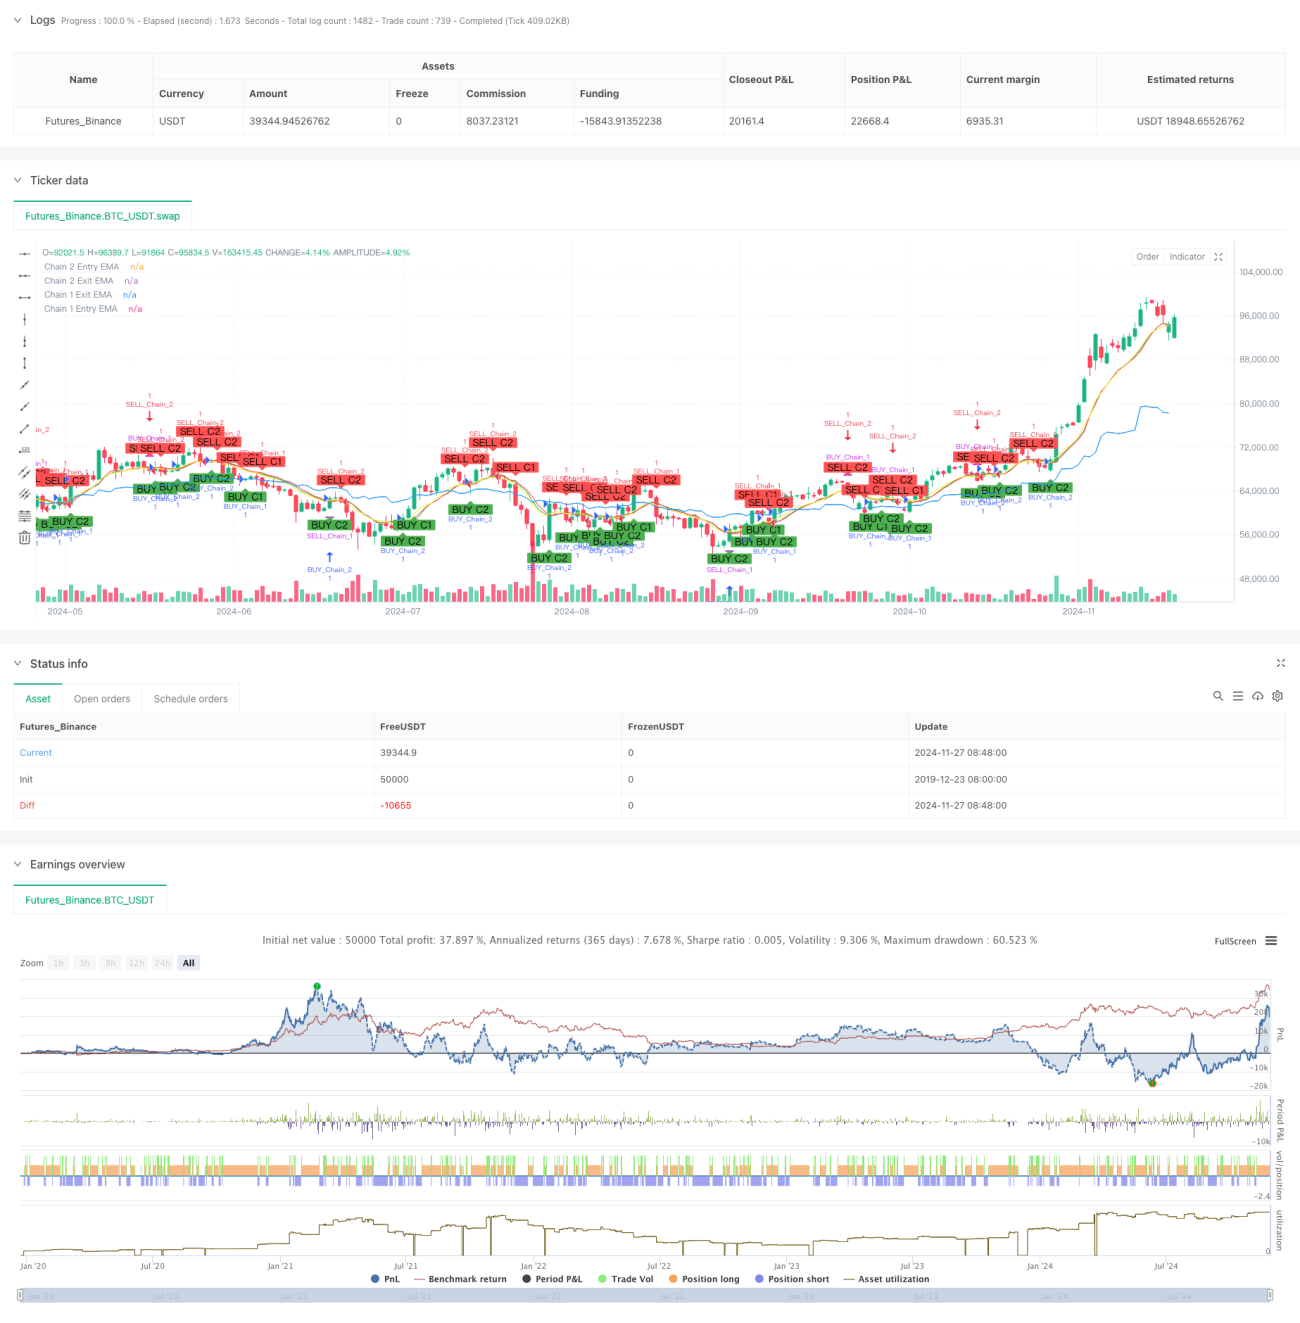
La estrategia es un sistema de negociación innovador basado en el índice de medias móviles (EMA) para capturar oportunidades de mercado mediante la configuración de dos cadenas de negociación independientes en diferentes períodos de tiempo. La estrategia integra las ventajas del seguimiento de tendencias a largo plazo y el comercio de volúmenes de movimiento a corto plazo para generar señales de negociación a través del cruce de EMA en varios períodos de tiempo, como el semanal, el diurno, las 12 horas y las 9 horas.
Principio de estrategia
La estrategia utiliza un diseño de dos cadenas, cada una con su propia lógica de entrada y salida:
La cadena 1 ((Tendencias a largo plazo) utiliza el ciclo de la línea de circunferencia y la línea de solsticio:
- Señales de entrada: se producen señales de multiplicación cuando el precio de cierre atraviesa el EMA en el ciclo de la línea circular
- Señales de salida: se produce una señal de cerraje cuando el precio de cierre atraviesa el EMA bajo el ciclo de la línea de sol
- El ciclo EMA por defecto es de 10, que se puede ajustar según sea necesario
La cadena 2 (movimiento a corto plazo) utiliza ciclos de 12 horas y 9 horas:
- Señales de entrada: se producen señales múltiples cuando el precio de cierre atraviesa el EMA en un ciclo de 12 horas
- Señales de salida: Se produce una señal de salida cuando el precio de cierre atraviesa un EMA en un ciclo de 9 horas
- El ciclo EMA por defecto es de 9, pero se puede ajustar según sea necesario.
Ventajas estratégicas
- Análisis multidimensional del mercado: una visión global de las tendencias del mercado a través de una combinación de diferentes períodos de tiempo
- Flexible: las dos cadenas se pueden activar o desactivar independientemente para adaptarse a diferentes estilos de negociación
- Control de riesgos perfeccionado: Confirmación en múltiples ciclos de tiempo, reduciendo el riesgo de falsas señales
- Parámetros ajustables: el ciclo EMA y el ciclo de tiempo se pueden modificar según sea necesario
- Funcionalidad de retroalimentación avanzada: configuración durante la retroalimentación incorporada para facilitar la verificación y optimización de la estrategia
Riesgo estratégico
- Riesgo de cambio de tendencia: Posible atraso en un mercado muy volátil
- Configuración de riesgo de ciclo de tiempo: diferentes mercados pueden requerir diferentes combinaciones de ciclos de tiempo
- Riesgo de optimización de parámetros: la optimización excesiva puede conducir a una sobreadaptación
- Riesgo de superposición de señales: la activación simultánea de dos cadenas puede aumentar el riesgo de tenencia de posiciones
Sugerencias para el control de riesgos:
- Establecer un límite de pérdidas razonable
- Ajuste de parámetros según las características del mercado
- Se realizan pruebas de retroalimentación antes de la puesta en marcha
- Controlar el ratio de capital para cada transacción
Dirección de optimización de la estrategia
- Optimización del filtrado de señales:
- Añadir mecanismo de confirmación de volumen
- Introducción de las señales de filtración de los indicadores de fluctuación
- Aumento de la intensidad de la tendencia confirmada
- Optimización del control de riesgos:
- Desarrollo de mecanismos de detención de pérdidas dinámicas
- Diseño de un sistema de gestión de posiciones
- Añadido el control de retiro
- Optimización del ciclo de tiempo:
- Estudiar la combinación óptima de los ciclos de tiempo
- Desarrollo de mecanismos de ciclo de tiempo de adaptación
- Aumentar el reconocimiento del estado del mercado
Resumir
El sistema de comercio de seguimiento de la línea media de la cantidad mixta de la cadena doble permite el análisis y la comprensión multidimensional del mercado mediante la combinación innovadora de la estrategia de la línea media de largo plazo. El diseño del sistema es flexible, se puede ajustar según las diferentes condiciones del mercado y el estilo del comerciante, y tiene una gran utilidad.
- 1