Estrategia comercial de optimización del impulso RSI combinada con cruce de media móvil doble

Descripción general
Esta estrategia es un sistema de negociación a corto plazo basado en una combinación de indicadores de doble línea de cruce y RSI. La estrategia utiliza una media móvil de índice de 9 períodos y 21 períodos (EMA) como base para determinar la tendencia, mientras que combina un indicador relativamente fuerte (RSI) como herramienta de confirmación de dinámica para lograr la gestión del riesgo mediante el establecimiento de paradas y paradas fijas.
Principio de estrategia
La lógica central de la estrategia se basa en la interacción de dos indicadores técnicos. En primer lugar, se determina la dirección de la tendencia del mercado a través de la cruz de los EMA de 9 y 21 ciclos. Se considera una tendencia alcista cuando el EMA de corto plazo se eleva por encima del EMA de largo plazo; se considera una tendencia bajista cuando el EMA de corto plazo se eleva por encima del EMA de largo plazo.
Ventajas estratégicas
- La claridad de la señal: El doble mecanismo de filtrado mediante el cruce de la línea media y la confirmación RSI permite reducir eficazmente las señales falsas.
- Control de riesgo: La configuración de stop loss de porcentaje fijo permite un control claro de la expectativa de riesgo de cada transacción.
- Alto grado de automatización: La lógica de la estrategia es clara y los parámetros son ajustables, lo que facilita la automatización de las transacciones.
- Adaptabilidad: Las estrategias pueden adaptarse a diferentes entornos de mercado, especialmente en mercados con claras tendencias.
- Simple de manejar: Las condiciones de entrada y salida son claras, lo que facilita la ejecución y el seguimiento de los operadores.
Riesgo estratégico
- Riesgo de mercado en movimiento: puede generar falsas señales frecuentes en mercados en movimiento horizontal, lo que provoca pérdidas continuas.
- Riesgo de deslizamiento: En el comercio de líneas cortas con un ciclo de 5 minutos, se puede enfrentar un mayor riesgo de deslizamiento.
- Riesgo de pérdidas fijas: el uso de pérdidas fijas por ciento puede no ser adecuado para todos los entornos de mercado, y en mercados especialmente volátiles puede ser demasiado densa.
- Riesgo sistémico: cuando ocurren acontecimientos importantes en el mercado, los paros fijos pueden no proteger eficazmente los fondos.
Dirección de optimización de la estrategia
- Optimización dinámica de stop loss: Se puede considerar la posibilidad de ajustar dinámicamente la distancia de stop loss en función de los indicadores ATR para que el stop loss se adapte mejor a las características de la volatilidad del mercado.
- Filtrado por tiempo: Aumente el filtro por períodos de negociación para evitar períodos de gran volatilidad o poca liquidez.
- Confirmación de la intensidad de la tendencia: se puede agregar un indicador ADX para confirmar la intensidad de la tendencia y solo se puede negociar cuando la tendencia es clara.
- Optimización de la gestión de posiciones: el tamaño de las posiciones se puede ajustar según la volatilidad del mercado y la dinámica del valor neto de la cuenta.
- Identificación del entorno de mercado: Aumentar el mecanismo de juicio del entorno de mercado, adoptando diferentes configuraciones de parámetros en diferentes condiciones de mercado.
Resumir
La estrategia, mediante la combinación de cruces de línea media y indicadores RSI, construye un sistema de trading de línea corta relativamente completo. La estrategia tiene la ventaja de que la señal es clara y el riesgo es controlable, pero también hay espacio para la optimización. La estabilidad y la rentabilidad de la estrategia se pueden mejorar aún más mediante la adición de mecanismos como el stop loss dinámico y el filtro de tiempo.
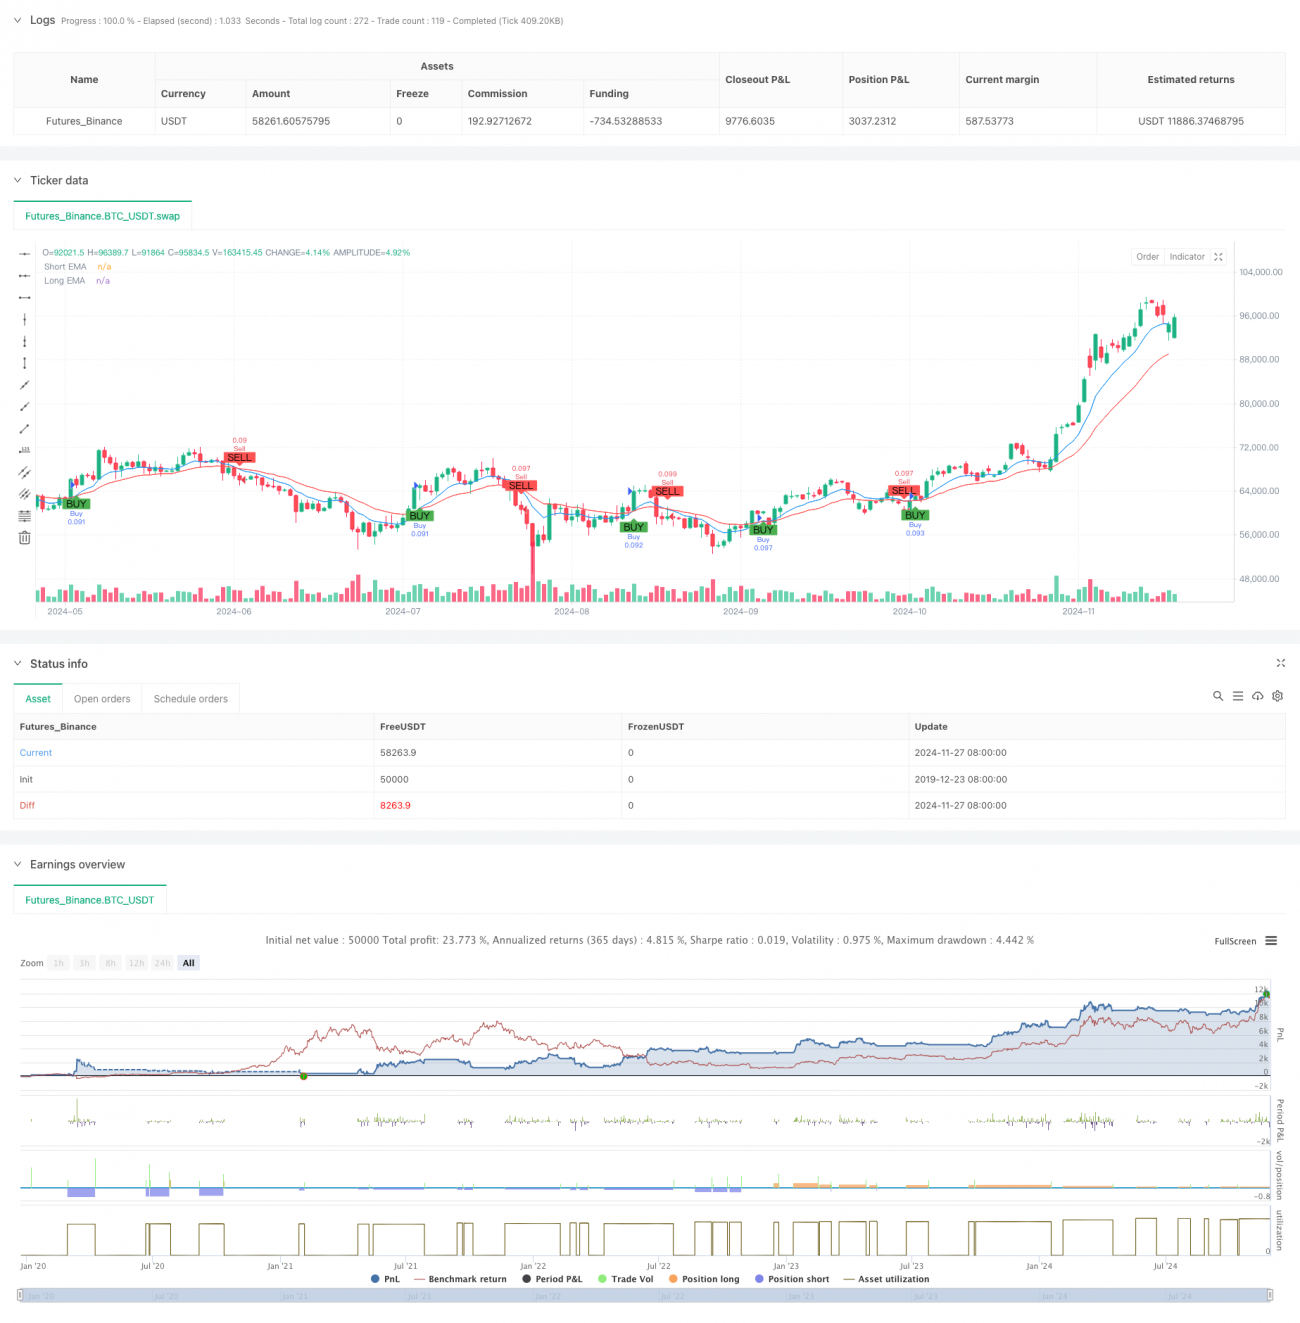
/*backtest
start: 2019-12-23 08:00:00
end: 2024-11-28 08:00:00
period: 1d
basePeriod: 1d
exchanges: [{"eid":"Futures_Binance","currency":"BTC_USDT"}]
*/

//@version=5
strategy("abo 3llash - EMA + RSI Strategy", overlay=true, default_qty_type=strategy.percent_of_equity, default_qty_value=10)

// Parameters- 1