Ruptura de triángulo combinada con estrategia de impulso RSI

Descripción general
La estrategia es un sistema de trading cuantitativo basado en la combinación de las formas de precios y los indicadores técnicos. Se realiza principalmente mediante la identificación de las rupturas de las formas triangulares y la confirmación de la dinámica de los indicadores RSI. La estrategia utiliza un método de regresión lineal para construir una línea de tendencia ascendente y descendente y determinar las señales de negociación a través de las rupturas de precios y la posición del RSI, lo que permite una combinación orgánica de análisis de forma y análisis de dinámica.
Principio de estrategia
La lógica central de la estrategia incluye dos partes principales: la identificación de la forma del triángulo y la confirmación de la dinámica del RSI. En primer lugar, se utilizan métodos de regresión lineal para calcular los máximos y mínimos de los últimos N ciclos y se construye una línea de tendencia ascendente para formar un triángulo.
Ventajas estratégicas
- Claridad de la estructura: La estrategia combina de manera orgánica el análisis morfológico y el análisis de la dinámica, aumentando la fiabilidad de las transacciones mediante la doble confirmación.
- Flexibilidad de parámetros: proporciona una longitud de triángulo ajustable y parámetros de ciclo RSI para facilitar la optimización de diferentes características del mercado.
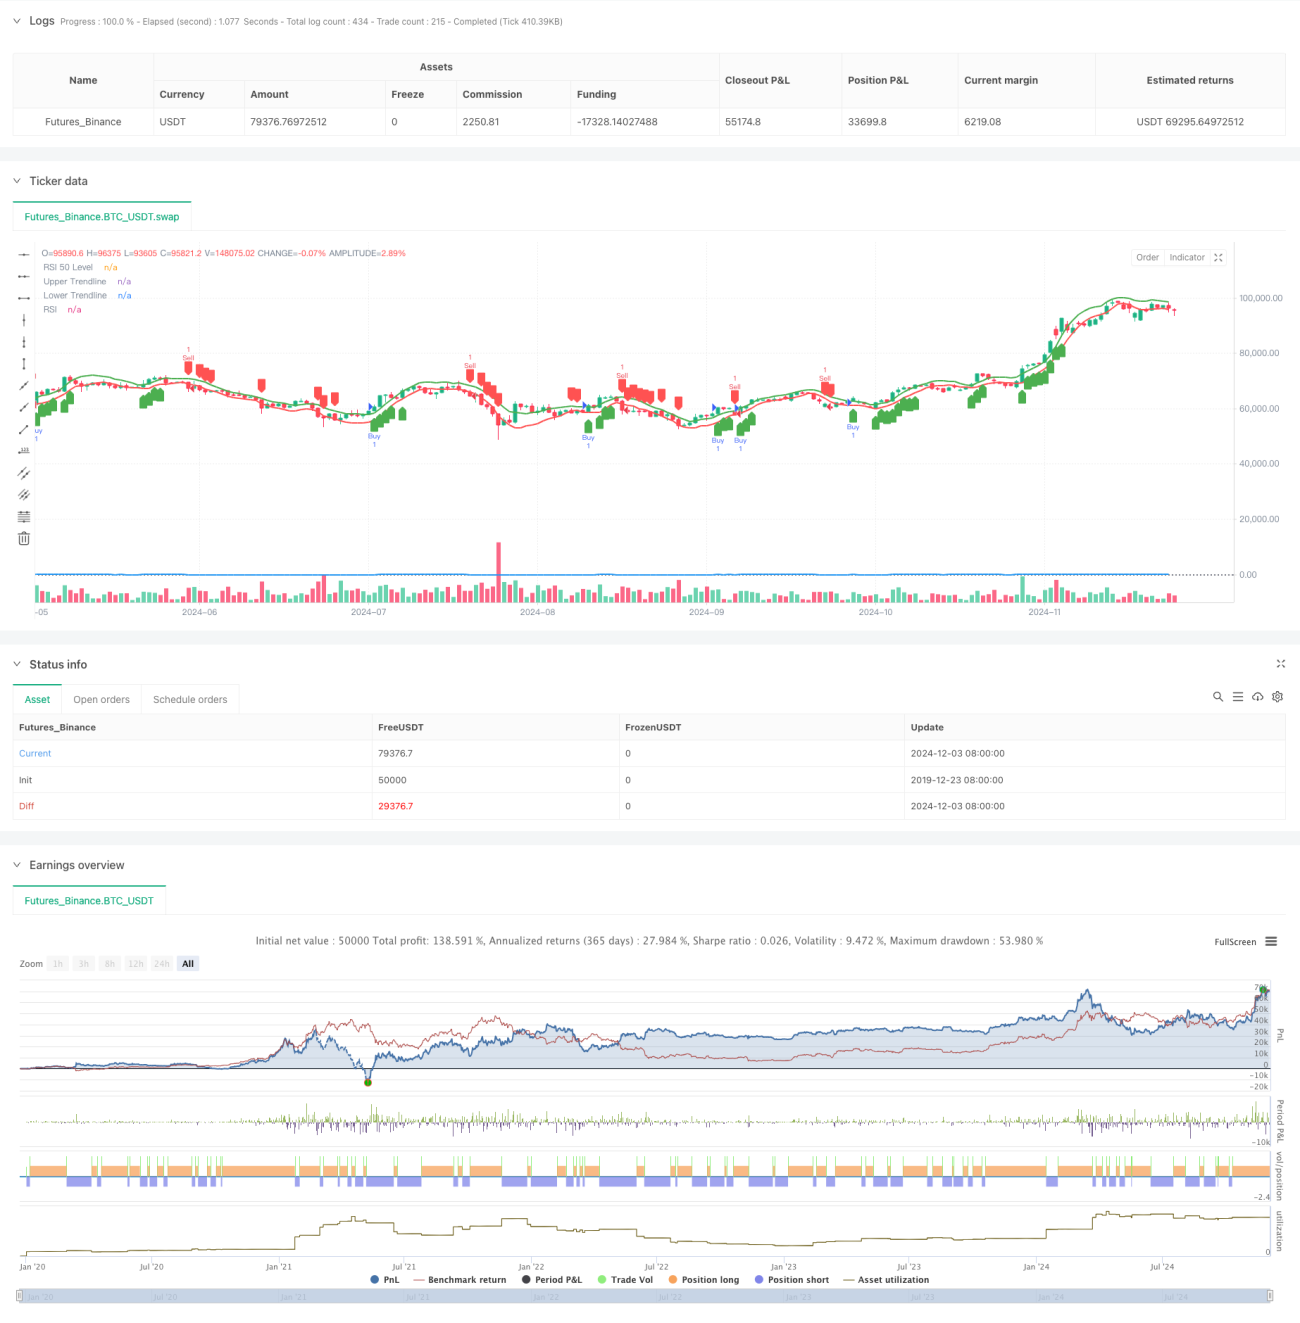
- Fuerte visualización: muestra claramente las líneas de tendencia y las señales de negociación en los gráficos, lo que facilita el monitoreo estratégico y el análisis de retroalimentación.
- Riesgo controlado: El RSI actúa como un filtro para reducir el riesgo de false breakouts.
Riesgo estratégico
- En un contexto de crisis, las transacciones pueden ser frecuentes y aumentar los costos.
- Las líneas de tendencia se calculan a partir de datos históricos, y pueden ser de retraso en mercados de rápida fluctuación.
- El RSI puede generar falsas señales en ciertas condiciones de mercado.
- La estrategia no tiene un mecanismo de stop loss y puede sufrir grandes pérdidas en momentos de fuertes fluctuaciones en el mercado.
Dirección de optimización de la estrategia
- Introducir un mecanismo de stop loss: Se recomienda agregar stop loss fijo o stop loss móvil para controlar el riesgo.
- Optimización de la hora de entrada: se puede considerar aumentar la confirmación de la cantidad de transacciones y mejorar la fiabilidad de la señal de ruptura.
- Mejor filtro de señales: Se puede agregar un filtro de tendencia para evitar el comercio frecuente en el mercado horizontal.
- Optimización de parámetros dinámicos: Se recomienda ajustar la longitud del triángulo y el umbral del RSI en función de la dinámica de la volatilidad del mercado.
Resumir
La estrategia Triangular Breakout combinada con la dinámica RSI es un sistema de comercio cuantitativo de estructura completa y lógica clara. A través de un mecanismo de doble confirmación de forma y dinámica, se mejora la fiabilidad de la señal de comercio. Aunque existe cierto riesgo, la estrategia tiene un buen valor práctico a través de medidas razonables de optimización de parámetros y control de riesgos.
- 1