Estrategia de negociación combinada de volatilidad y momentum RSI-ATR

Descripción general
Se trata de un sistema de estrategias de negociación que combina el indicador de volúmenes RSI y el indicador de fluctuaciones ATR. La estrategia identifica oportunidades de negociación potenciales mediante la monitorización de la intersección entre el RSI y sus medias móviles, mientras que el indicador ATR sirve como un filtro de fluctuación para asegurar que el mercado tenga suficiente volatilidad. La estrategia se ejecuta durante el horario de negociación europeo ((hora de Praga 8:00-21:00), con un período de 5 minutos y un nivel fijo de stop loss.
Principio de estrategia
La lógica central de la estrategia se basa en los siguientes componentes clave:
- El indicador RSI se utiliza para identificar zonas de sobrecompra y sobreventa, cuando el RSI es inferior a 45 se considera zona de sobreventa y superior a 55 se considera zona de sobrecompra
- El cruce del RSI con su promedio móvil como condición para la señal de entrada
- El indicador ATR se utiliza para filtrar entornos de baja volatilidad y solo permite el comercio cuando el ATR está por encima del umbral establecido
- El horario de negociación está limitado a las 8:00-21:00 hora de Praga
- La estrategia de stop loss fija está configurada de forma predeterminada en 5000 puntos
Las reglas específicas de las transacciones son las siguientes:
- Multicondicionamiento: el RSI cruza con su promedio móvil por debajo de 45 y cumple con las condiciones de tiempo de negociación y volatilidad
- Condiciones de apertura: el RSI cruza a la baja con su promedio móvil por encima de 55 y cumple con las condiciones de tiempo de negociación y volatilidad
- Condiciones de salida: toque el punto de parada o el punto de parada automático
Ventajas estratégicas
- Mecanismo de filtración múltiple: combina el indicador de potencia (RSI) y el indicador de fluctuación (ATR) para reducir eficazmente las señales falsas
- Filtración de tiempo: evita la interferencia en momentos de baja liquidez al limitar las ventanas de tiempo de negociación
- Gestión de riesgos mejorada: establecimiento de paradas y pérdidas fijas para facilitar la administración de fondos
- Parámetros ajustables: los parámetros clave, como la longitud del RSI, el umbral ATR, etc., se pueden optimizar en función de las diferentes condiciones del mercado
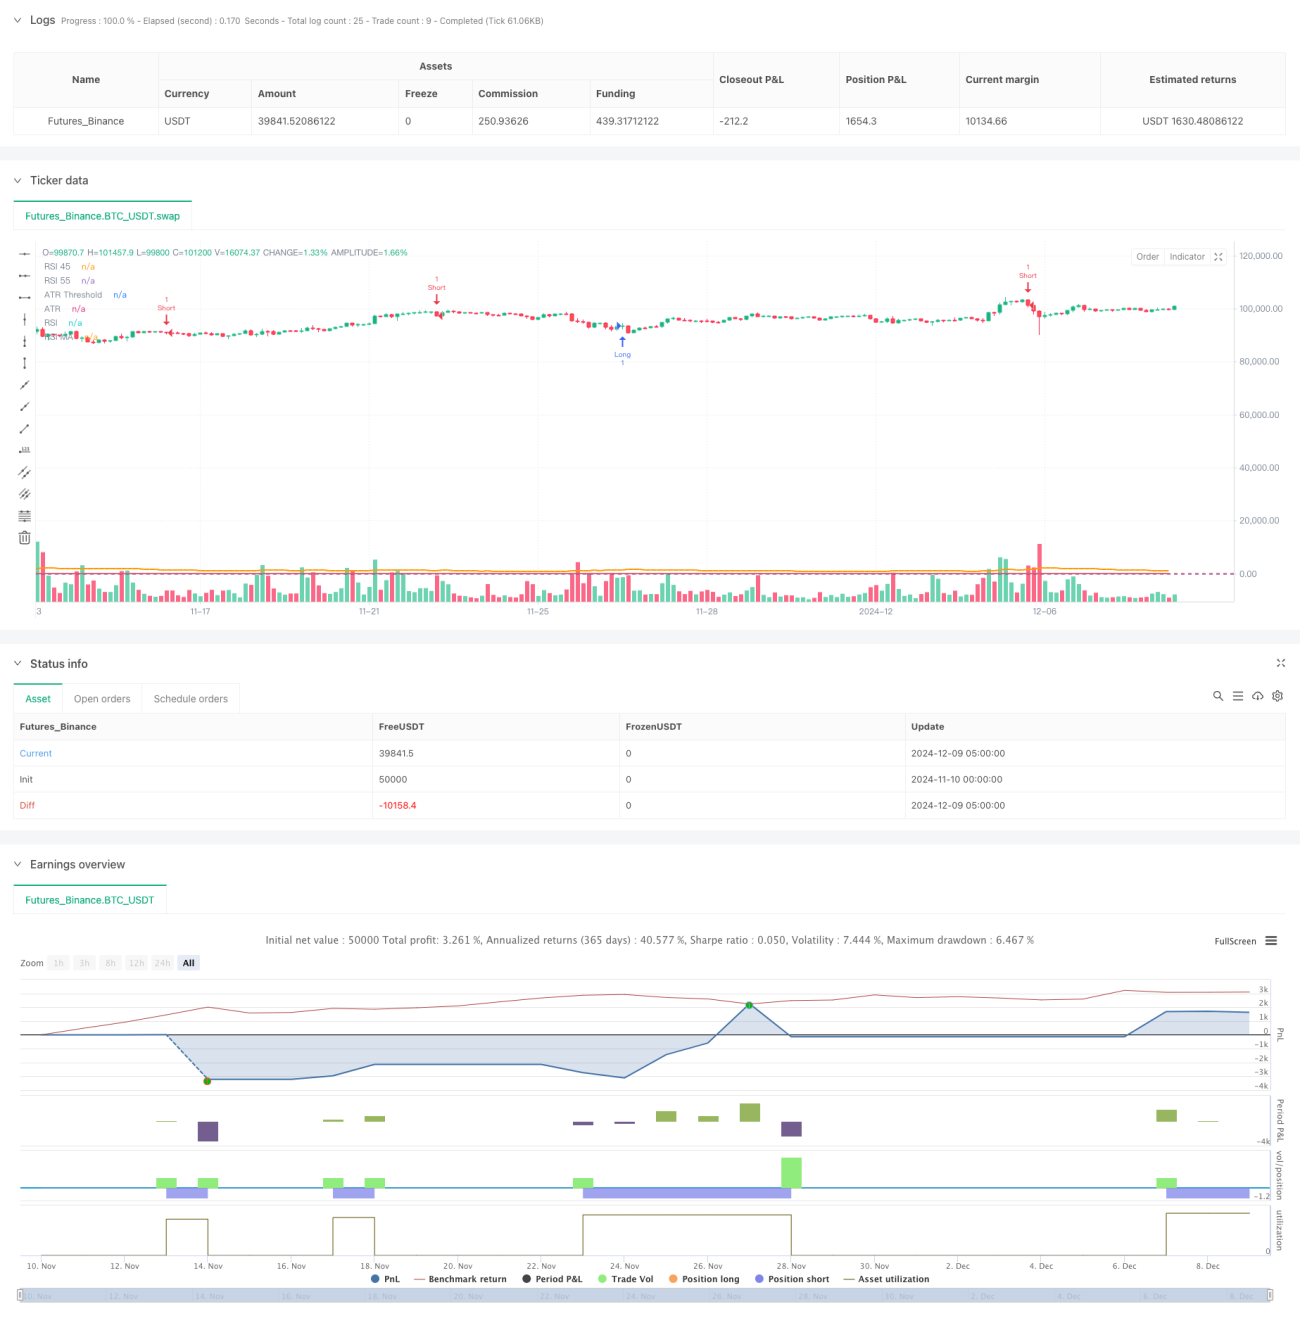
- Los resultados de la retrospectiva son sólidos: con un porcentaje de victorias del 64.4% y un margen de ganancias y pérdidas del 1.1%, teniendo en cuenta los puntos de deslizamiento y las comisiones.
Riesgo estratégico
- El stop-loss fijo puede no ser adecuado para todos los mercados y puede conducir a una salida prematura en períodos de gran volatilidad
- El RSI puede generar falsas señales frecuentes en mercados de tendencia
- El filtro ATR podría hacer que la estrategia pierda algunas oportunidades de mercado importantes
- Las restricciones de la ventana horaria pueden hacer que se pierda una oportunidad de negociación de calidad en otros momentos.
- La estrategia depende de la optimización de los parámetros, la optimización excesiva puede conducir a un riesgo de sobreajuste
Dirección de optimización de la estrategia
- Paradas de parada dinámicas: se puede considerar ajustar la amplitud de las paradas de parada en función de la dinámica de ATR para adaptarla mejor a las fluctuaciones del mercado
- Filtración de tendencias: aumentar los indicadores de tendencia, como el sistema de medias móviles, para reducir las falsas señales en los mercados convulsivos
- Cambios en el tiempo de entrada: se puede considerar la adición de un indicador de volumen de transacciones como confirmación auxiliar para mejorar la calidad de entrada
- Optimización de las ventanas: ajustar las ventanas de tiempo de negociación según las características de los diferentes mercados para capturar más oportunidades
- Aumento del módulo de gestión de fondos: gestión dinámica de la escala de la cartera para un mejor control de los riesgos
Resumir
La estrategia combina los indicadores RSI y ATR para construir un sistema de negociación relativamente completo. La principal ventaja de la estrategia reside en el mecanismo de filtración múltiple y la gestión de riesgos, pero también tiene algunas limitaciones. La estrategia tiene la posibilidad de obtener un mejor rendimiento a través de la dirección de optimización propuesta. La clave es ajustar y optimizar los parámetros constantemente según el entorno de negociación real, manteniendo la adaptabilidad de la estrategia.
- 1