
Descripción general
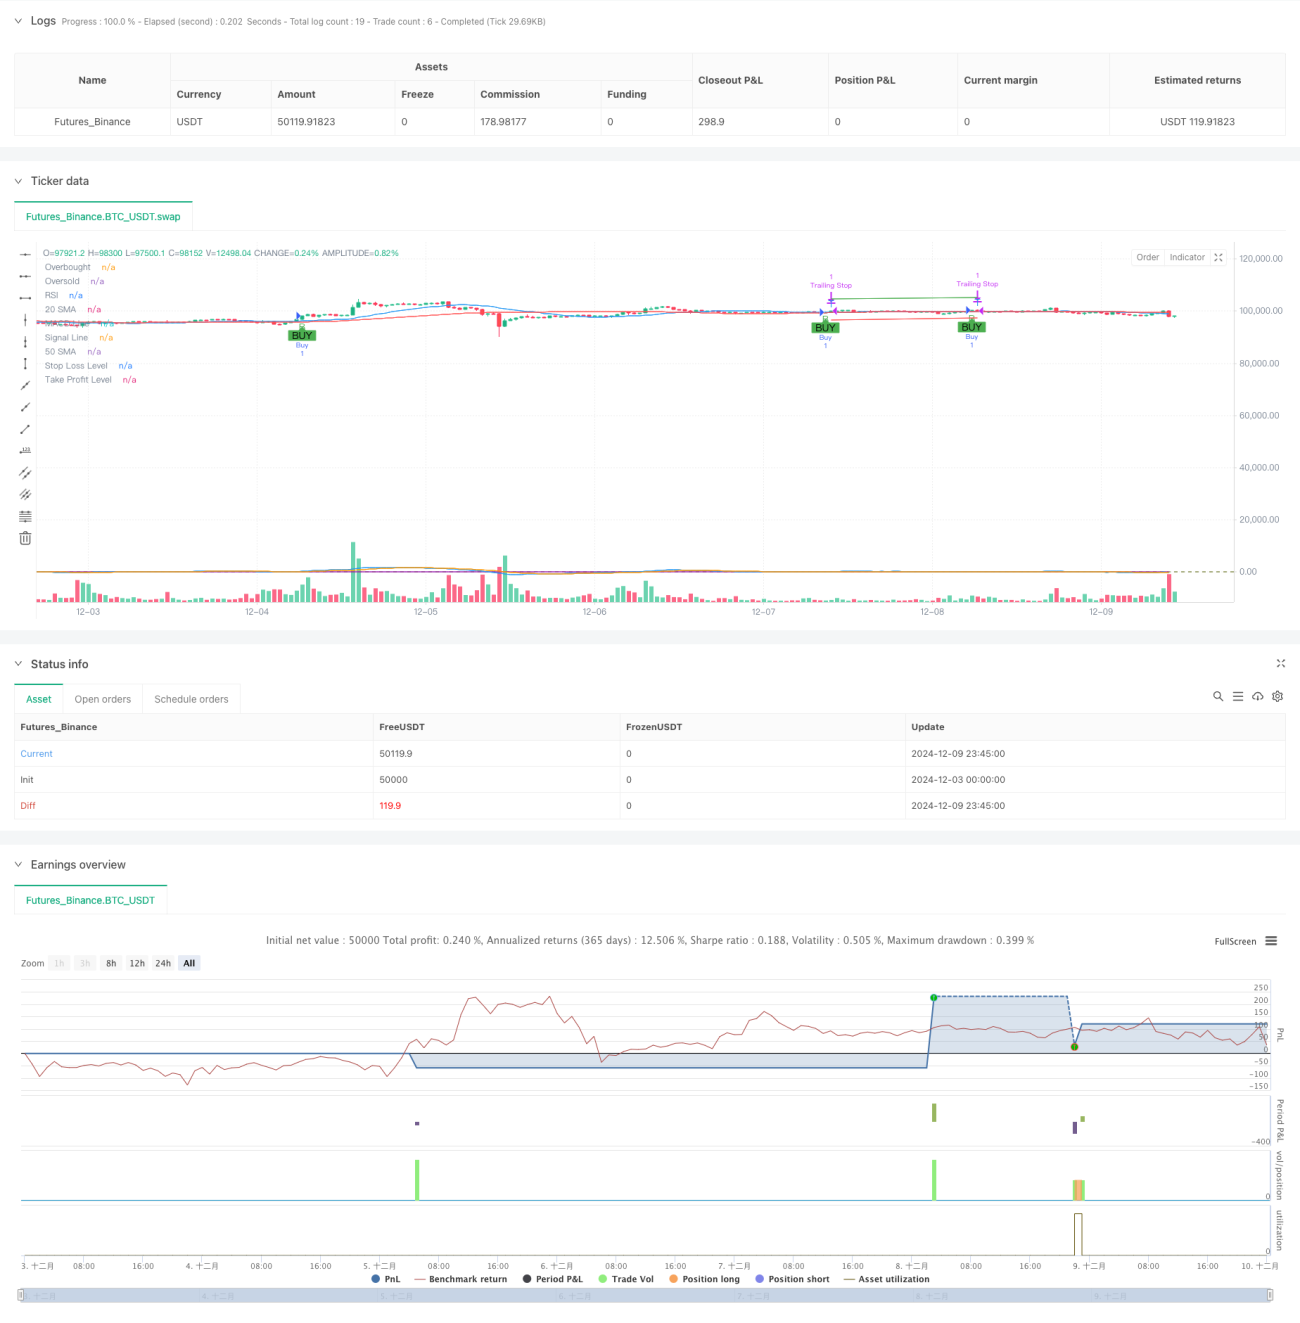
La estrategia es un sistema de comercio de seguimiento de tendencias que combina múltiples indicadores técnicos. Se realiza mediante la integración de varios indicadores técnicos, como el RSI (indicador de la fuerza relativa), el MACD (indicador de la dispersión de la tendencia de la media móvil) y el SMA (medio móvil simple) para operar cuando la tendencia del mercado es clara. La estrategia también incluye mecanismos de gestión de riesgos como el stop loss, el stop loss y el seguimiento del stop loss para lograr una mejor gestión de fondos.
Principio de estrategia
Las estrategias se basan en las siguientes condiciones centrales para operar:
- El indicador MACD aparece con una horca de oro (la línea MACD atraviesa la línea de señal)
- El RSI está por debajo de 70, evita zonas de sobrecompra
- El precio está por encima de la media a corto plazo (la media de 20 días)
- La media a corto plazo está por encima de la media a largo plazo (la media de 50 días)
Cuando se cumplen las condiciones anteriores, el sistema emite una señal múltiple. Al mismo tiempo, la estrategia establece un objetivo de stop loss del 5%, un límite de stop loss del 3%, y un stop loss de seguimiento del 2% para proteger los beneficios obtenidos. Este diseño de condiciones de transacción en varios niveles ayuda a mejorar la precisión y seguridad de las transacciones.
Ventajas estratégicas
- El uso integrado de múltiples indicadores técnicos mejora la fiabilidad de las señales de negociación
- El RSI filtra las zonas de sobrecompra para evitar entradas en niveles altos
- El uso de un sistema de medias líneas ayuda a confirmar tendencias a medio y largo plazo
- Mecanismos adecuados de gestión de riesgos, incluidos los límites fijos y los límites de seguimiento
- Los parámetros de la estrategia se pueden ajustar con flexibilidad para adaptarse a diferentes entornos del mercado
- El rango de tiempo de transacción puede personalizarse para facilitar la retroalimentación y la aplicación en el mercado real
Riesgo estratégico
- Las múltiples señales pueden causar un retraso en la señal y afectar el tiempo de entrada.
- Pueden producirse señales falsas en mercados volátiles
- El Stop Loss Ratio fijo puede no ser adecuado para todos los entornos de mercado
- El seguimiento de los stop losses puede ser una salida prematura de la ventaja cuando el mercado es más volátil.
Las medidas de mitigación incluyen: ajuste adecuado de los parámetros de los indicadores, ajuste de la proporción de stop loss en función de las diferentes características del mercado, aumento de los filtros de entorno de mercado, etc.
Dirección de optimización de la estrategia
- Introducción de indicadores de volatilidad (como ATR) para hacer que el stop loss sea más adaptable
- Aumentar la eficacia de las señales de verificación de los indicadores de volumen de transacción
- Añadir un mecanismo de evaluación del entorno de mercado, con diferentes parámetros en diferentes condiciones de mercado
- Optimización de los parámetros MACD para mejorar la puntualidad de la señal
- Consideración de la inclusión de señales de retroceso para la realización de la función de vacío
Estas medidas de optimización pueden mejorar la adaptabilidad y la estabilidad de las estrategias.
Resumir
La estrategia se basa en el uso combinado de múltiples indicadores técnicos para crear un sistema de negociación relativamente completo. No solo contiene la lógica central de seguimiento de tendencias, sino que también integra consideraciones de gestión de riesgos. Si bien hay algunos lugares que necesitan optimización, el marco general tiene una buena escalabilidad y adaptabilidad.
- 1