Estrategia de seguimiento de tendencias de múltiples indicadores combinada con un sistema de negociación de canal dinámico y promedio móvil

Descripción general
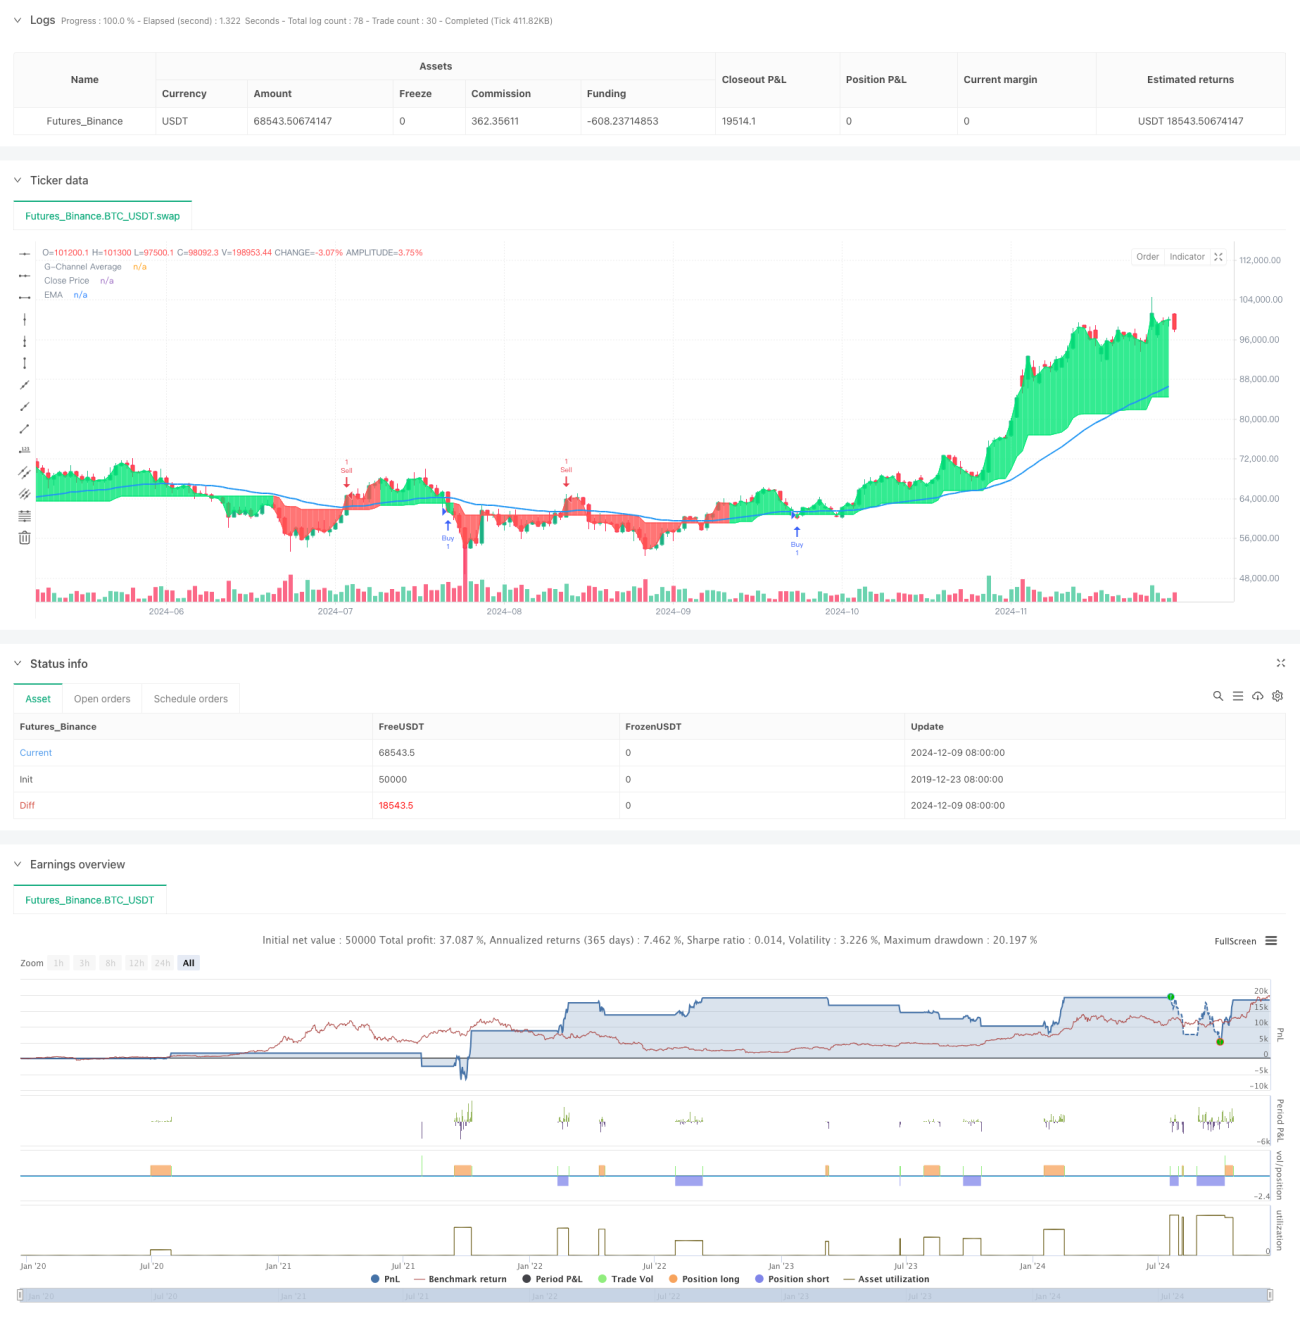
La estrategia es un sistema de trading multiindicador que combina el canal G, el índice de movimiento medio (EMA) y la amplitud de fluctuación real (ATR). Identifica las señales de negociación a través de soporte/resistencia dinámicos y confirmación de tendencias, y administra el riesgo utilizando paros y paradas basadas en ATR. El sistema está diseñado para centrarse en la fiabilidad y el control del riesgo, y es adecuado para los operadores que buscan una forma de negociación robusta.
Principio de estrategia
La lógica central de la estrategia se basa en los siguientes componentes clave:
- El canal G calcula los niveles dinámicos de soporte y resistencia, que se ajustan constantemente en la subida y bajada de la vía mediante fórmulas matemáticas
- La EMA se utiliza para confirmar la dirección de la tendencia general, y la posición relativa del precio con respecto a la EMA determina la dirección de la operación.
- La señal de entrada se basa en la ruptura del canal G y la confirmación de la posición del EMA
- Utiliza el múltiplo de ATR para configurar el stop y el stop, el stop es 2 veces ATR y el stop es 4 veces ATR
- Evita la repetición de señales por seguimiento de estado
Ventajas estratégicas
- El mecanismo de confirmación de señales en varios niveles mejora la fiabilidad de las transacciones
- Límites de canal ajustados dinámicamente para adaptarse a diferentes entornos de mercado
- La gestión del riesgo basada en la volatilidad es más adaptable
- Evitar la repetición de señales reduce el riesgo de exceso de transacciones
- Las marcas de compra y venta visuales y claras facilitan el análisis y la retroalimentación.
Riesgo estratégico
- El mercado horizontal podría generar demasiadas falsas brechas
- La EMA como indicador de retraso puede causar retrasos en el tiempo de entrada
- El stop loss ATR de multiplicador fijo puede no ser lo suficientemente flexible en períodos de alta volatilidad
- Indicadores que requieren datos históricos más largos
- La optimización de parámetros puede provocar sobreajuste
Dirección de optimización de la estrategia
- Introducción de señales de confirmación de tránsito para mejorar la fiabilidad de la brecha
- Ajuste dinámico de los multiplicadores ATR para adaptarse a las diferentes condiciones de fluctuación del mercado
- Añadir filtros de entornos de mercado para evitar operaciones en condiciones desfavorables
- Optimización de la lógica de filtración de señales para reducir aún más las falsas señales
- Considerar la incorporación de un sistema de gestión de posiciones dinámico
Resumir
La estrategia construye un sistema de negociación completo mediante la combinación de varios indicadores técnicos bien desarrollados. La ventaja del sistema radica en su mecanismo de confirmación de señales en varios niveles y la gestión de riesgos basada en la volatilidad, pero aún así se necesita optimizar en la aplicación real de acuerdo con las características específicas del mercado.
- 1