
Descripción general
La estrategia es un sistema de negociación integrado que combina el análisis del indicador de la fuerza relativa (RSI), el indicador de dispersión de la convergencia de las medias móviles (MACD), el cinturón de Brin (BB) y el volumen (Volume). La estrategia se combina con indicadores técnicos multidimensionales para realizar un análisis integral de las tendencias del mercado, la volatilidad y el volumen de transacciones, para identificar las mejores oportunidades de negociación.
Principio de estrategia
La lógica central de la estrategia se basa en los siguientes aspectos:
- El RSI ((14) se utiliza para determinar el estado de sobreventa en el mercado. El RSI inferior a 30 se considera sobreventa.
- Utiliza el MACD ((12, 26, 9) para determinar la dirección de la tendencia, el MACD Gold Fork como una señal de multiplicación
- Confirmar la efectividad de la tendencia de los precios calculando la diferencia entre el aumento del volumen de transacciones y el descenso del volumen de transacciones (Delta Volume)
- Combinado con Brin para evaluar la volatilidad de los precios para optimizar el momento de entrada
- El sistema emite una señal de compra óptima en caso de que el RSI esté sobrevendido, el MACD sea tenso y el Delta Volume positivo
- Cuando el MACD Dead Fork o el RSI es superior a 60, el sistema automáticamente cierra las posiciones para controlar el riesgo
Ventajas estratégicas
- La verificación cruzada de múltiples indicadores mejora la fiabilidad de las señales de transacción
- Eficacia de las tendencias de precios mediante análisis de volumen de transacciones
- Incluye opciones de tipo de media móvil adaptada, lo que aumenta la flexibilidad de la estrategia
- Dispone de un buen mecanismo de control de riesgos, incluyendo paradas y paradas
- Los parámetros de la estrategia se pueden ajustar de manera óptima en función de las diferentes condiciones del mercado
Riesgo estratégico
- La combinación de múltiples indicadores puede causar retraso en la señal
- Las señales falsas en el mercado horizontal
- La optimización excesiva de parámetros puede provocar un sobreajuste
- Las transacciones de alta frecuencia pueden generar costos más elevados
- El mercado puede ser más volátil en caso de grandes fluctuaciones.
Dirección de optimización de la estrategia
- Introducción de un mecanismo de parámetros de adaptación para ajustar los parámetros del indicador en función de las condiciones dinámicas del mercado
- Aumentar los filtros de intensidad de tendencia y reducir las falsas señales en el mercado horizontal
- Optimizar el mecanismo de suspensión de pérdidas y mejorar la eficiencia de la utilización de fondos
- Incorporación de un filtro de volatilidad para ajustar posiciones en un entorno de alta volatilidad
- Desarrollo de sistemas inteligentes de gestión de fondos para el control dinámico de posiciones
Resumir
Se trata de una estrategia de comercio de tipo complejo que combina varios indicadores técnicos para capturar oportunidades de mercado a través de un análisis multidimensional de RSI, MACD, volumen de transacción, etc. La estrategia tiene una gran adaptabilidad y escalabilidad, además de un buen mecanismo de control de riesgos. A través de la optimización y mejora continuas, la estrategia espera mantener un rendimiento estable en diferentes entornos de mercado.
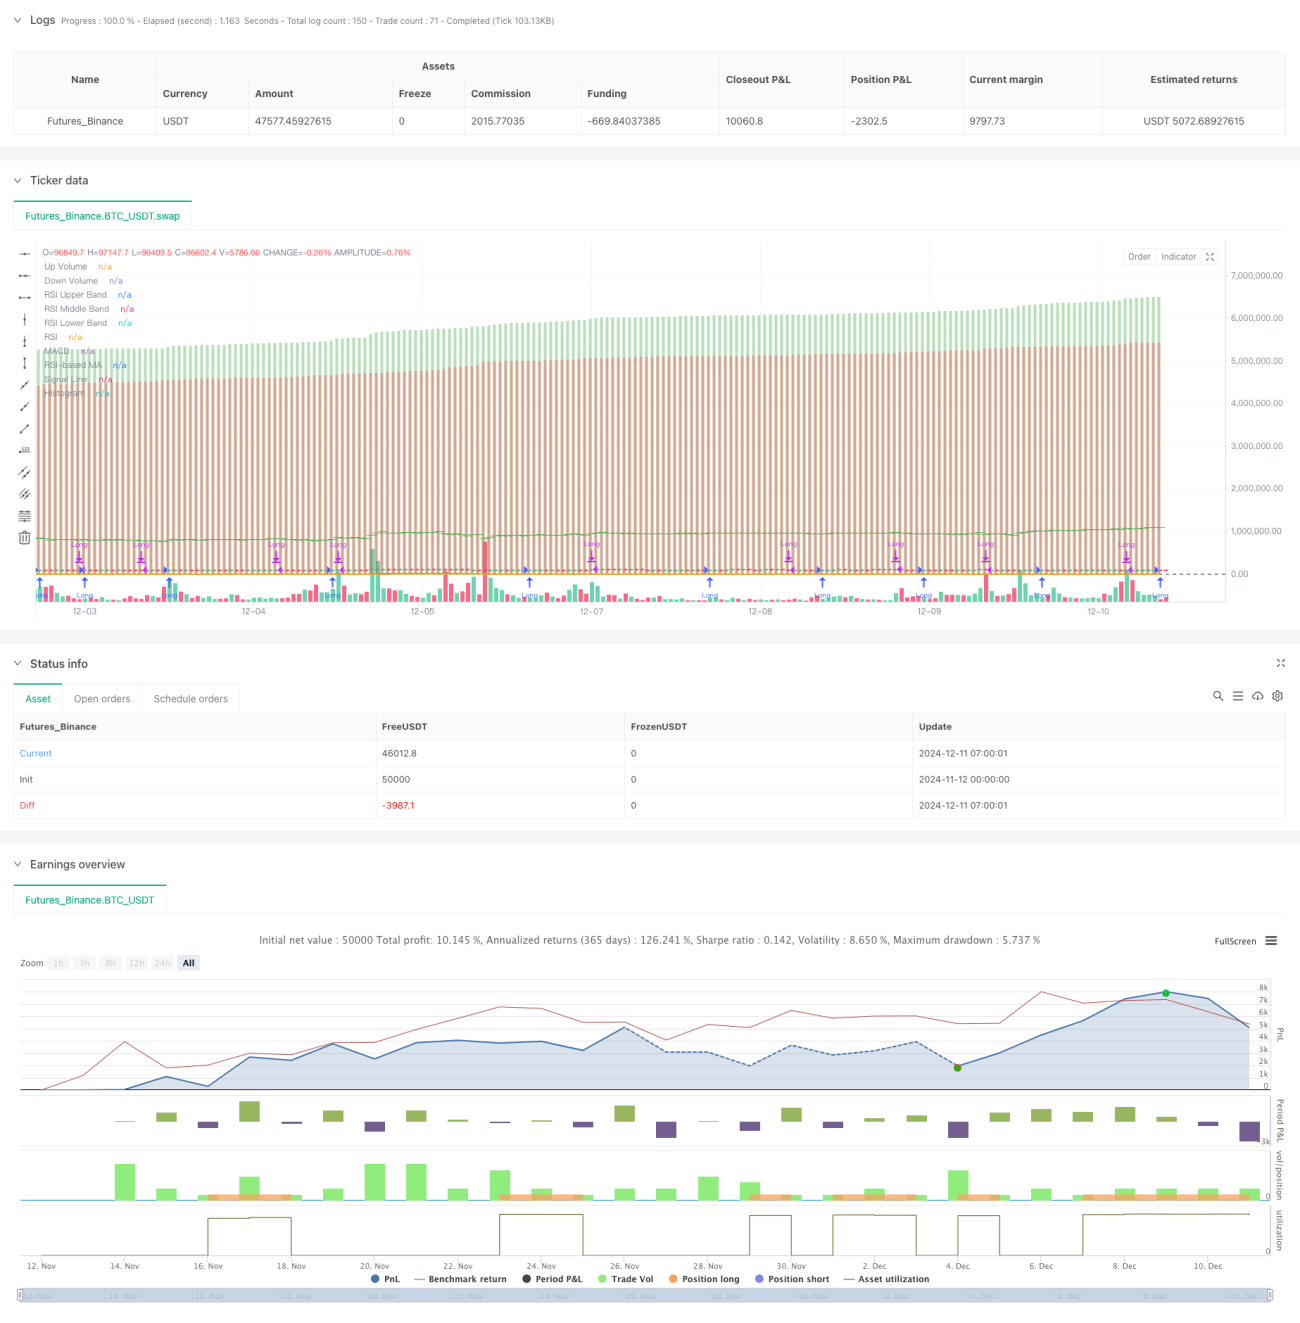
/*backtest
start: 2024-11-12 00:00:00
end: 2024-12-11 08:00:00
period: 1h
basePeriod: 1h
exchanges: [{"eid":"Futures_Binance","currency":"BTC_USDT"}]
*/

//@version=5
strategy("Liraz sh Strategy - RSI MACD Strategy with Bullish Engulfing and Net Volume", overlay=true, currency=currency.NONE, initial_capital=100000, commission_type=strategy.commission.percent, commission_value=0.1, slippage=3)

// Input parameters- 1