
Descripción general
La estrategia es un sistema de seguimiento de tendencias basado en el análisis técnico, que combina el sistema de líneas medias, el indicador de movimiento RSI y el indicador de volatilidad ATR para confirmar oportunidades de negociación mediante la verificación de múltiples señales. La estrategia utiliza una línea de medias cruzada de múltiples períodos para determinar la tendencia del mercado, al tiempo que combina la dinámica RSI para confirmar la fuerza del precio y, finalmente, utiliza el ATR para establecer paros y ganancias dinámicas, formando un sistema de negociación completo.
Principio de estrategia
La lógica central de la estrategia incluye tres partes clave:
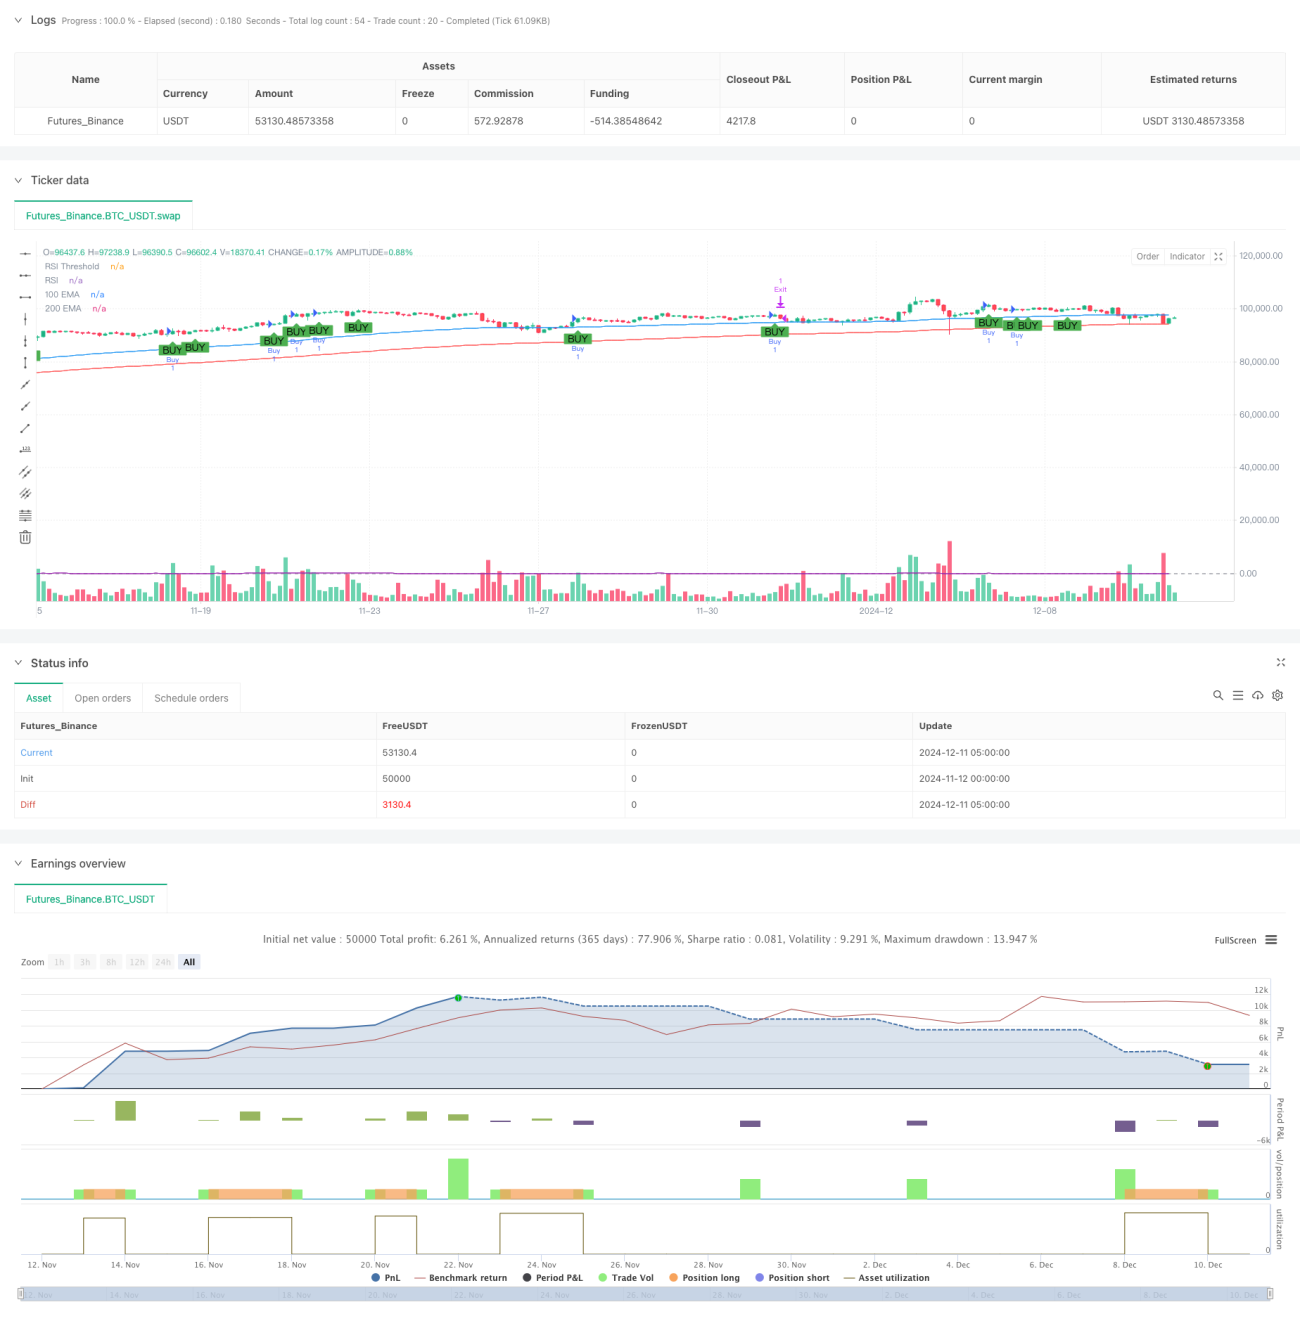
- Determinación de tendencias: utiliza una media móvil indexada de 100 y 200 ciclos (EMA) para confirmar la dirección de la tendencia del mercado. Cuando la EMA a corto plazo está por encima de la EMA a largo plazo, indica que el mercado está en una tendencia alcista.
- Señales de entrada: Basadas en la confirmación de la tendencia, la estrategia busca la forma de absorción de la avalancha como punto de entrada específico y filtra la señal con el indicador RSI. Cuando el RSI es mayor que 50, indica que el mercado tiene suficiente dinámica alcista.
- Gestión de posiciones: utiliza el ATR de 14 ciclos para medir la volatilidad del mercado y, en consecuencia, configurar de forma dinámica los niveles de stop loss y gain. El stop loss se establece en 1.1 veces el ATR y el objetivo de gain es 2.0 veces el ATR, lo que garantiza una relación de ganancias y pérdidas mayor a 1 .
Ventajas estratégicas
- Verificación de múltiples señales: reduce considerablemente el impacto de las señales falsas mediante la combinación de tendencias, formas de precios y indicadores de movimiento.
- Gestión de riesgos dinámica: configuración de pérdidas y ganancias basada en el ATR, que puede adaptarse a la volatilidad del mercado, evitando las limitaciones de los puntos fijos.
- Características de seguimiento de tendencias: Evita el comercio innecesario en mercados de alto y bajo, al juzgar las tendencias con un sistema de línea media.
- Un marco de negociación completo: Contiene un sistema de estrategias completas para la entrada, salida y administración de posiciones.
Riesgo estratégico
- Retraso de la tendencia: El EMA como indicador de retraso puede causar un retraso en el tiempo de entrada y puede perder el punto de entrada óptimo en un mercado de rápida fluctuación.
- Compilando el riesgo del mercado: en los mercados horizontales, los cruces de medias frecuentes pueden causar exceso de operaciones.
- Riesgo de falsa ruptura: La forma de absorción de la palma puede dar lugar a falsas rupturas, que deben ser manejadas mediante un estricto control de riesgos.
- El riesgo de la configuración de stop loss: un número demasiado pequeño de ATR puede causar un stop loss demasiado frecuente, mientras que un número demasiado grande puede asumir un riesgo demasiado grande.
Dirección de optimización de la estrategia
- Introducción de indicadores de tráfico: se puede aumentar la fiabilidad de la señal mediante la adición de confirmación de tráfico.
- Optimización del ciclo de la línea media: se puede ajustar el ciclo de la línea media en función de las diferentes características del mercado para adaptarlo mejor al ritmo del mercado.
- Mecanismos de detención de pérdidas: se puede considerar la adición de detención móvil, ya que la protección es rentable si la tendencia continúa.
- Aumentar el filtro de entornos de mercado: introducir un margen de fluctuación para reducir la frecuencia de las operaciones en entornos de mercado excesivamente volátiles.
- Optimización de los parámetros del RSI: se puede rastrear el RSI en base a los datos históricos para encontrar los mínimos óptimos y el ciclo de cálculo.
Resumir
La estrategia integra varios indicadores técnicos para construir un sistema de seguimiento de tendencias lógicamente completo. Las ventajas de la estrategia residen en la verificación de múltiples señales y la gestión de riesgos dinámicos, pero también se debe tener en cuenta el tratamiento de riesgos como el retraso de la tendencia y los falsos reveses. La estrategia aún tiene una gran mejora mediante la adición de confirmación de volumen, optimización de la configuración de parámetros, etc.
- 1