
Descripción general
La estrategia es un sistema de negociación de ruptura de momentum basado en las bandas de Bollinger, que captura oportunidades de tendencia principalmente a través de la relación entre el precio y la banda de Bollinger. La estrategia utiliza un mecanismo de selección de tipo de línea uniforme adaptativo, combinado con un canal de diferencia estándar para identificar las características de la volatilidad del mercado, especialmente adecuado para aplicaciones en entornos de mercado con mucha volatilidad.
Principio de estrategia
La lógica central de la estrategia se basa en los siguientes elementos clave:
- Utiliza una media móvil personalizable (incluyendo SMA, EMA, SMMA, WMA y VWMA) para calcular el orbital de la banda de Bollinger.
- La posición de subida y bajada se determina dinámicamente mediante el múltiplo de la diferencia estándar ((default 2.0)).
- El aumento de la entrada cuando el precio se desvía indica la formación de una fuerte tendencia de ruptura.
- Cuando el precio cae por debajo de la línea de fondo, la salida a la brecha indica que la tendencia alcista puede haber terminado.
- El sistema tiene incorporado la consideración de los costos de transacción (<0.1%) y el punto de deslizamiento (<3 puntos), lo que se ajusta mejor al entorno de transacción real.
Ventajas estratégicas
- Adaptabilidad: La estrategia puede adaptarse a diferentes condiciones de mercado a través de la elección de varios tipos de línea media.
- Control de riesgos perfeccionado: proporciona un control de riesgos claro a través de la baja de la vía de Boling como punto de parada.
- La administración de fondos es razonable: la administración de la proporción de la posición evita el riesgo de los números fijos.
- El costo de la transacción está bien considerado: incluye comisiones y factores de deslizamiento, y los resultados de la retrospectiva están más cerca de lo real.
- Flexibilidad en el marco de tiempo: Se puede seleccionar un rango de tiempo de negociación específico mediante la configuración de parámetros.
Riesgo estratégico
- Riesgo de brechas falsas: Las señales de brechas falsas pueden ser frecuentes en mercados convulsos.
Solución: Se puede agregar un indicador de confirmación o un mecanismo de entrada tardía. - Riesgo de reversión de la tendencia: puede causar grandes pérdidas si el mercado de tendencias fuertes se revuelve repentinamente.
Solución: Se puede agregar un filtro de intensidad de tendencia. - Sensibilidad de los parámetros: diferentes combinaciones de parámetros pueden generar grandes diferencias en el rendimiento de la estrategia.
Solución: Se requieren pruebas de robustez y optimización de parámetros.
Dirección de optimización de la estrategia
- El indicador de intensidad de la tendencia es:
- Se puede agregar el ADX o indicadores similares para filtrar las señales de un mercado de tendencia débil
- Esto puede reducir los daños causados por las brechas falsas.
- Optimizar el mecanismo de detención de pérdidas:
- Se puede hacer un stop loss dinámico, como un stop loss de seguimiento
- La tendencia es que las inversiones en el sector de la construcción de viviendas y el sector de la construcción de viviendas aumenten.
- Añadir un filtro de transacciones:
- Señales de confirmación basadas en el volumen de transacciones
- Evite el comercio en un entorno de baja liquidez
- Mejoras en el sistema de inscripción:
- Mecanismos para aumentar la reincorporación
- Ayuda a obtener mejores precios de entrada
Resumir
Se trata de una estrategia de seguimiento de tendencias de diseño razonable, con claridad lógica. Capta la dinámica del mercado a través de las características dinámicas de las bandas de Bollinger y tiene un buen mecanismo de control de riesgos. La estrategia es altamente personalizable y puede adaptarse a diferentes entornos de mercado mediante la adaptación de parámetros. Se recomienda una adecuada optimización de parámetros y verificación de retroalimentación en la aplicación en el mundo real, y se recomienda una mejora de la estrategia en combinación con la dirección de optimización recomendada.
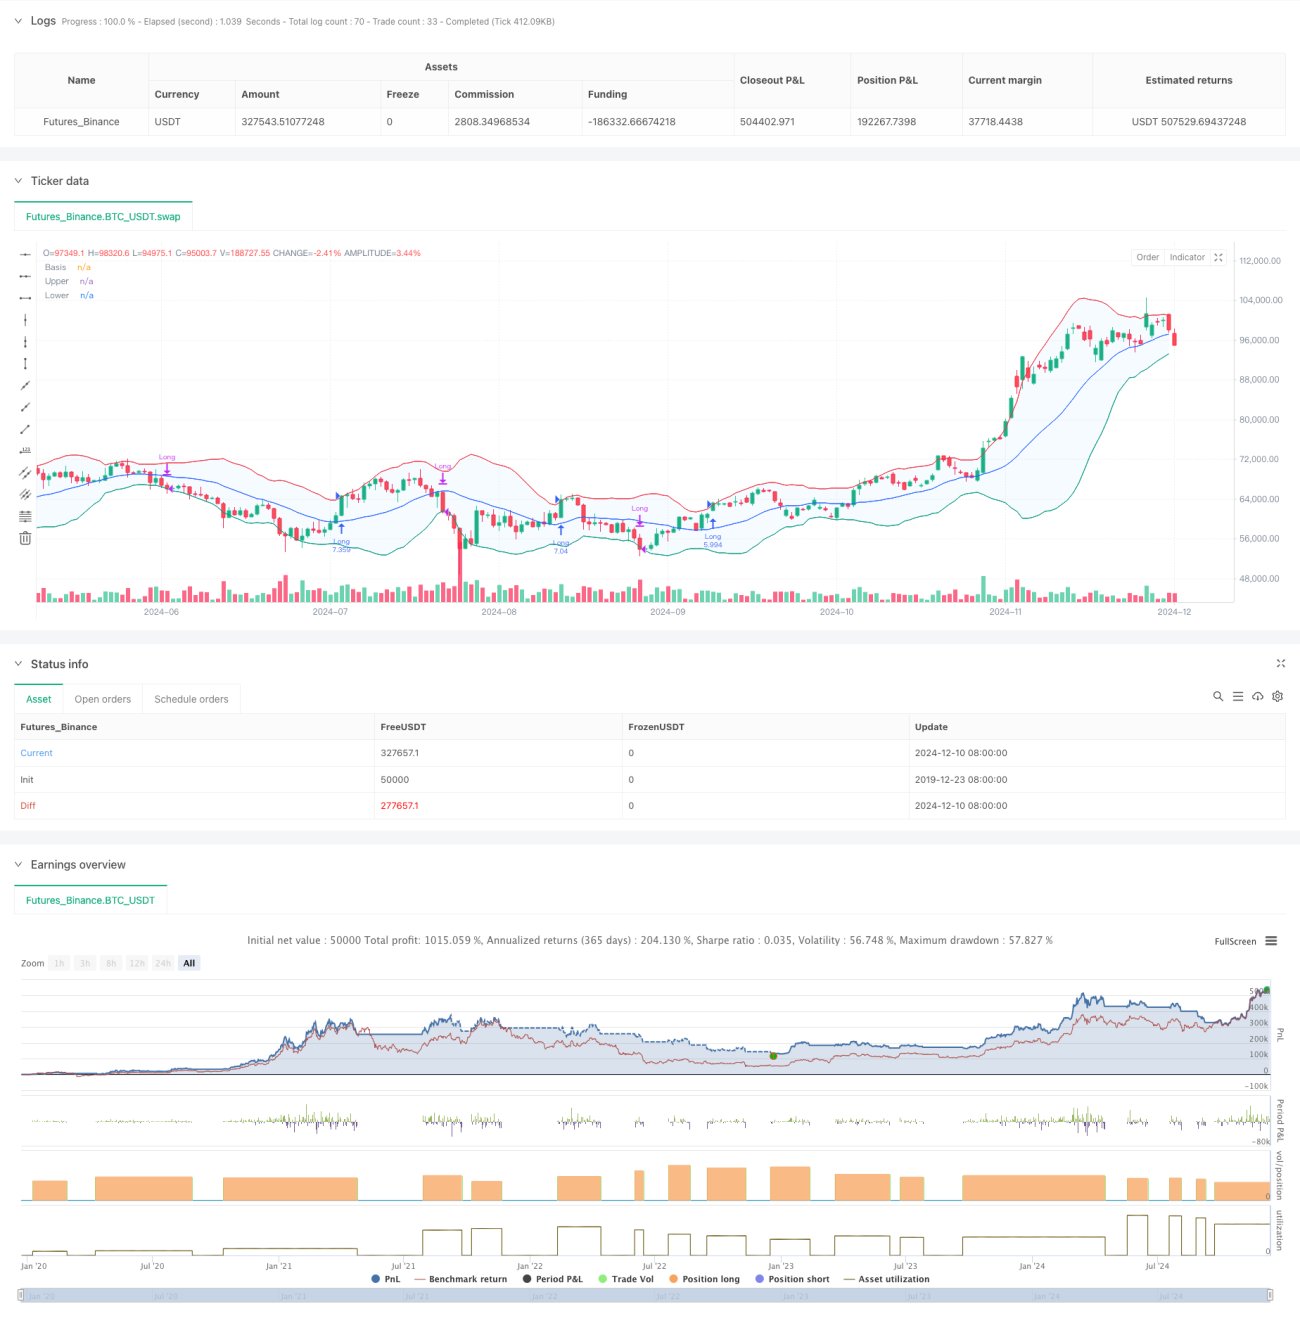
/*backtest
start: 2019-12-23 08:00:00
end: 2024-12-11 08:00:00
period: 1d
basePeriod: 1d
exchanges: [{"eid":"Futures_Binance","currency":"BTC_USDT"}]
*/

//@version=5
strategy("Demo GPT - Bollinger Bands", overlay=true, initial_capital=10000, commission_type=strategy.commission.percent, commission_value=0.1, slippage=3, default_qty_type=strategy.percent_of_equity, default_qty_value=100)

// Inputs- 1