
Descripción general de la estrategia
Se trata de una estrategia de negociación inteligente que combina la banda de Brin y el indicador de tendencia súper. La estrategia utiliza principalmente el Brin para identificar los rangos de fluctuación del mercado, mientras que el indicador de tendencia súper se utiliza para confirmar la dirección de la tendencia del mercado, para negociar en posiciones de alta probabilidad. La estrategia está diseñada para una variedad de variedades de negociación y períodos de tiempo, especialmente en períodos de 30 minutos y 2 horas.
Principio de estrategia
La lógica central de la estrategia se basa en los siguientes elementos clave:
- Utiliza una banda de Brin de 20 ciclos, con una banda ancha de 2 diferencias estándar, construida con una vía superior, media, baja y dos líneas medias
- Indicador de tendencia súper con 10 ATR de ciclo y un factor de 3 veces
- Señales de entrada:
- Entradas múltiples: cuando los precios tocan la banda de Brin y el indicador de tendencia súper es multidireccional
- Entrada en blanco: cuando el precio toca la banda de Brin y el indicador de tendencia súper es en la dirección de la cabeza
- La señal de salida:
- Salida múltiple: cuando el precio de cierre cae por debajo de la línea de tendencia súper y la tendencia se vuelve a la cabeza
- Salida en blanco: cuando el precio de cierre rompe la línea de tendencia súper y la tendencia se vuelve al extremo
Ventajas estratégicas
- Mecanismos de doble confirmación para aumentar la fiabilidad de las operaciones: combinando los rangos de fluctuación de las bandas de Bryn y la dirección de las tendencias súper, para reducir el riesgo de falsas rupturas
- Adaptarse a las fluctuaciones del mercado: el Brinband ajusta el ancho de banda automáticamente a las fluctuaciones del mercado, lo que permite una buena adaptabilidad de la estrategia
- Señales de negociación claras: las condiciones de entrada y salida son claras, fáciles de ejecutar y de retroceder
- Ajuste de parámetros flexibles: la longitud de la banda de Brin, el multiplicador de la banda de ancho de banda y los parámetros de tendencia súper se pueden ajustar según las diferentes condiciones del mercado
- Excelentes efectos de visualización: el uso de diferentes colores y formas para etiquetar las señales de negociación para facilitar su análisis y monitoreo
Riesgo estratégico
- Riesgo de mercado en movimiento: Falsa señal frecuente en situaciones de movimiento horizontal
- Riesgo de atraso: las bandas de Brin y las tendencias súper son indicadores de atraso, que pueden perder los mejores puntos de entrada en un movimiento rápido
- Sensibilidad de los parámetros: diferentes configuraciones de parámetros pueden generar grandes diferencias en el rendimiento de la estrategia.
Se recomienda que la estrategia tenga los siguientes controles de riesgo:
- Establecer una posición de stop loss para controlar el riesgo individual
- Considere suspender el comercio durante una época de gran volatilidad
- Optimizar periódicamente los parámetros para adaptarse a los cambios en el mercado
Dirección de optimización de la estrategia
- Aumentar el filtro de volatilidad del mercado:
- Ajuste el tamaño de la posición en un entorno de alta volatilidad
- Aumentar el filtro ATR para evitar transacciones durante períodos de exceso de volatilidad
- El objetivo es mejorar el mecanismo de suspensión de pérdidas:
- Posicionamiento de stop loss basado en el ancho de banda de Brin
- Estrategias de frenado dinámico diseñadas en combinación con la inclinación de la tendencia súper
- Se puede añadir un filtro temporal:
- Evitar el tiempo de publicación de datos importantes
- Configuración de diferentes parámetros para diferentes períodos de tiempo
- Mecanismo de optimización de la confirmación de señales:
- Confirmación de aumento de volumen
- Considere aumentar los indicadores de intensidad de la tendencia
Resumir
Es un sistema de negociación completo que combina indicadores clásicos de análisis técnico y puede funcionar bien tanto en tendencias como en fluctuaciones a través de la sinergia de las bandas de Brin y las supertendencias. El diseño visual de la estrategia y la flexibilidad de los parámetros la hacen muy práctica. La estabilidad y rentabilidad de la estrategia se puede mejorar aún más a través de la dirección de optimización recomendada.
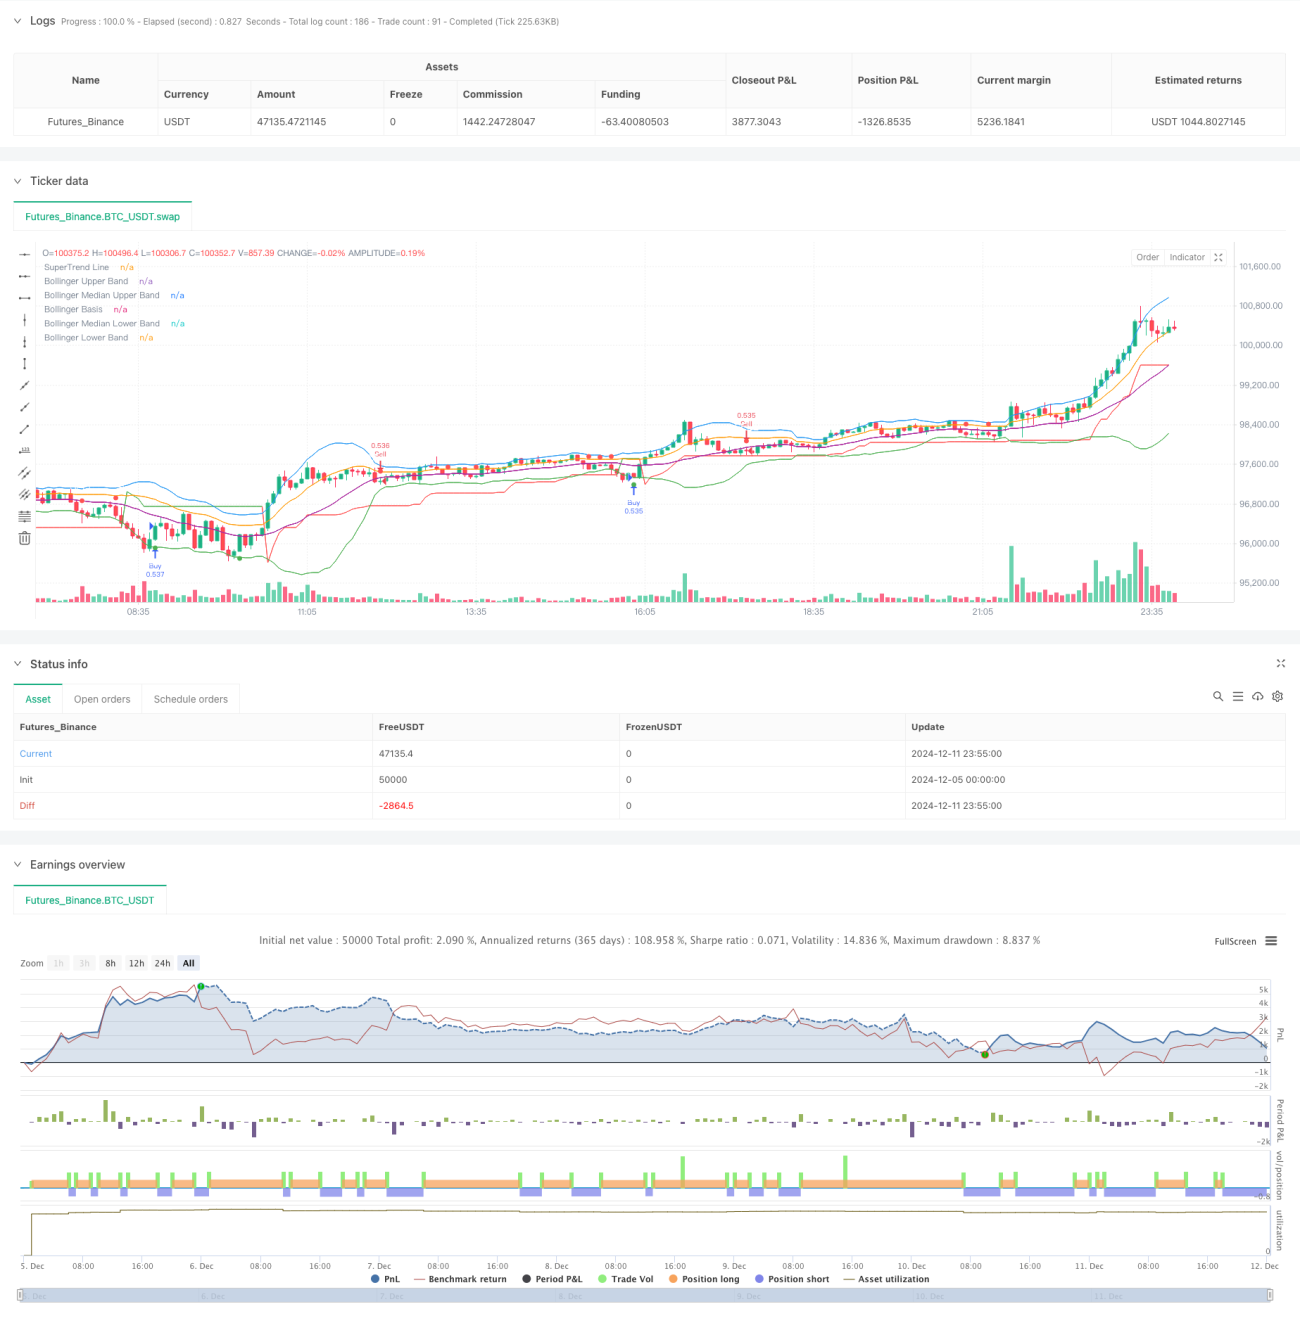
/*backtest
start: 2024-12-05 00:00:00
end: 2024-12-12 00:00:00
period: 5m
basePeriod: 5m
exchanges: [{"eid":"Futures_Binance","currency":"BTC_USDT"}]
*/

//@version=5
strategy("Bollinger Band & SuperTrend Strategy (Standard Chart)", overlay=true, default_qty_type=strategy.percent_of_equity, default_qty_value=100)

// Bollinger Bands Settings- 1