Investigación sobre la versión optimizada de la estrategia de entrada flexible de cruce de cinco días basada en RSI y MACD

Descripción general
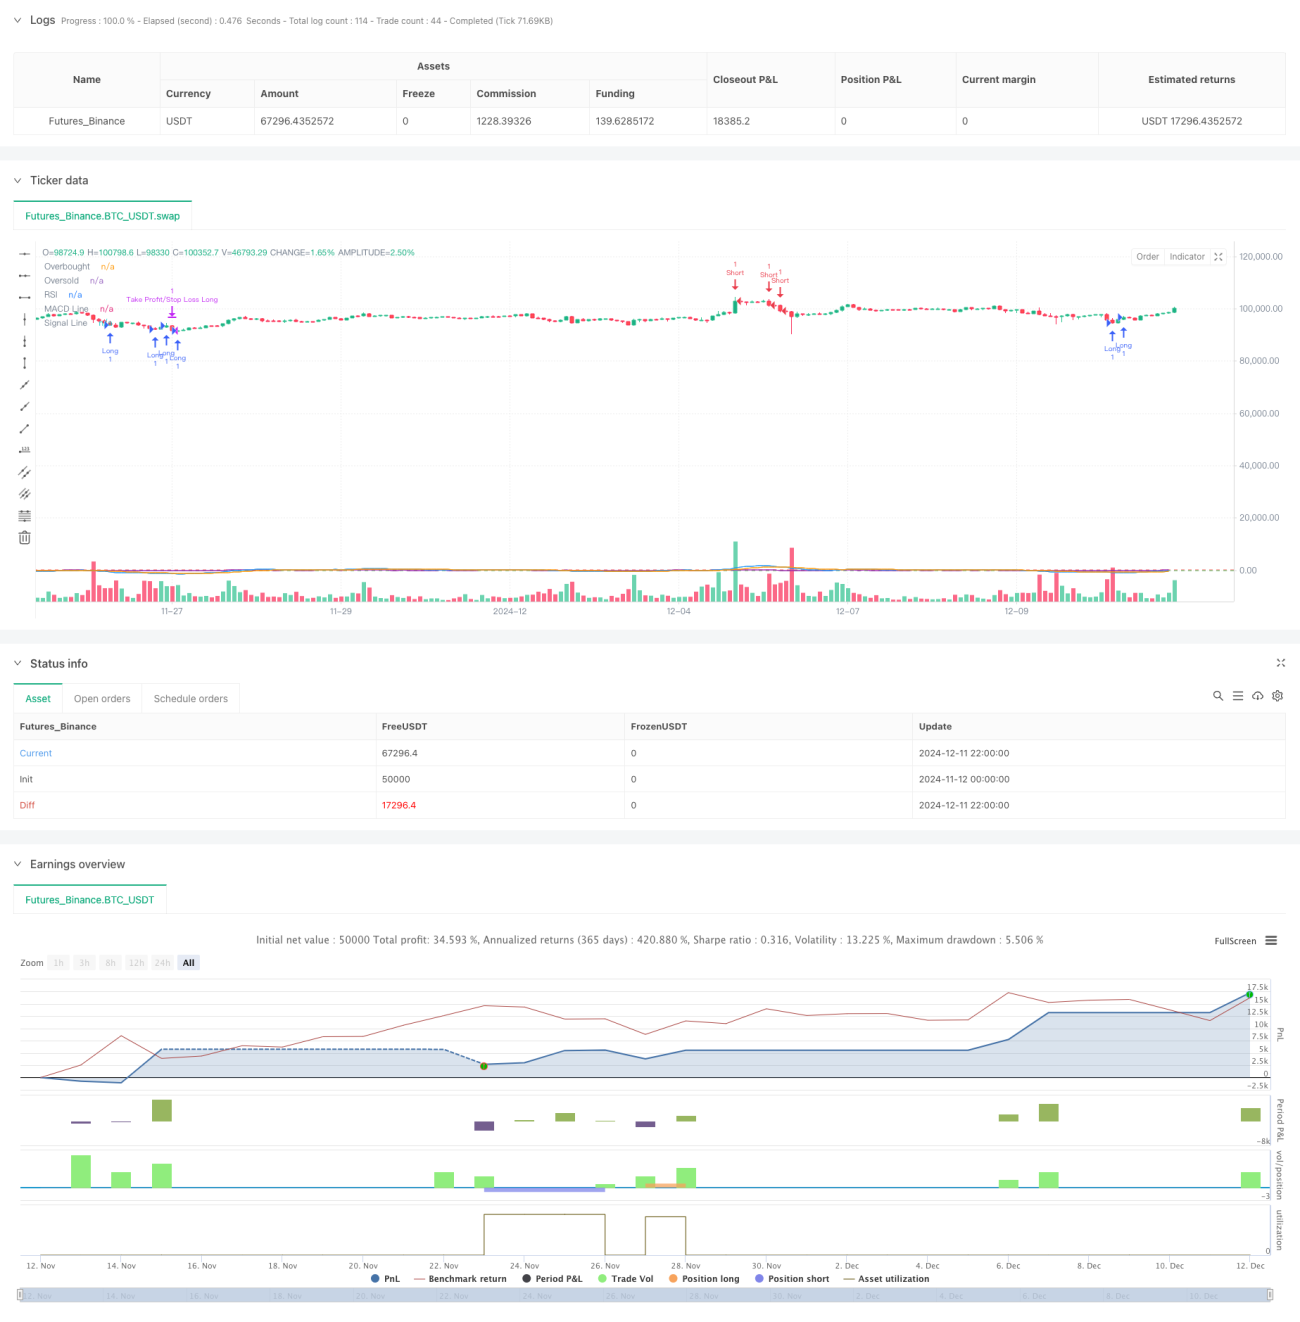
Esta estrategia es una estrategia de comercio cuantitativa que combina un índice relativamente débil (RSI) y un indicador de tendencia / dispersión de medias móviles (MACD). El núcleo de la estrategia consiste en determinar la dirección de la tendencia del mercado mediante la observación de las zonas de sobreventa / sobreventa en el RSI, en combinación con las señales cruzadas del indicador MACD en casi 5 ciclos de negociación, y establecer paradas de pérdida para controlar el riesgo. Este método no solo puede proporcionar señales de comercio más precisas, sino que también puede reducir eficazmente el riesgo de señales falsas.
Principio de estrategia
La estrategia se basa en los siguientes componentes centrales:
- El indicador RSI utiliza 14 ciclos como configuración de parámetros para identificar oportunidades potenciales de reversión al juzgar si un activo está en estado de sobrecompra (<70) o sobreventa (<30).
- El indicador MACD utiliza la combinación clásica de parámetros 12-26-9 para confirmar el cambio de tendencia mediante la búsqueda de la intersección de la línea MACD con la línea de señal en los 5 ciclos de negociación.
- La lógica de entrada incluye dos condiciones:
- Haga más condiciones: El RSI tiene un mínimo de menos de 30 en 5 períodos, mientras que la línea MACD aparece en casi 5 períodos de cruce ascendente con la línea de señal.
- Condiciones de vacío: el RSI tiene un máximo de más de 70 en 5 períodos, mientras que la línea MACD se cruza con la línea de señal hacia abajo en casi 5 períodos.
- El control de riesgo adopta una configuración simétrica de 2% de stop loss y 2% de stop loss.
Ventajas estratégicas
- La verificación cruzada de múltiples indicadores mejora la fiabilidad de la señal, y el uso de la combinación de RSI y MACD permite filtrar eficazmente las señales falsas que un solo indicador puede generar.
- La ventana de observación flexible de 5 días permite capturar más oportunidades de negociación y evitar perderse importantes momentos de cambio en el mercado.
- La configuración de stop loss simétrica es útil para la administración de fondos y puede controlar eficazmente el riesgo de una sola transacción.
- La lógica de la estrategia es simple y clara, fácil de entender y ejecutar, y se adapta a la optimización adicional de la estrategia básica.
Riesgo estratégico
- El RSI y el MACD son indicadores de retraso que pueden producirse en mercados con gran volatilidad.
- La proporción fija de stop-loss puede no ser adecuada para todos los entornos de mercado y debe ajustarse a tiempo para adaptarse a los cambios en la volatilidad.
- El período de observación de 5 días puede ser demasiado corto en ciertas condiciones de mercado, lo que puede conducir a una sobrecambio.
- Sin tener en cuenta el factor de volumen de transacciones, puede generar una señal inexacta en un entorno de baja liquidez.
Dirección de optimización de la estrategia
- Introducción de un mecanismo de adaptación de la volatilidad para ajustar dinámicamente la proporción de stop loss en función de las fluctuaciones del mercado.
- Aumentar los indicadores de tráfico como confirmación auxiliar para mejorar la fiabilidad de la señal.
- Desarrollar un mecanismo de selección de ciclo dinámico que ajuste automáticamente el tamaño de la ventana de observación según la situación del mercado.
- Añadir filtros de tendencia para evitar el comercio en contra en mercados de fuerte tendencia.
- Considere la posibilidad de introducir filtros de tiempo para evitar las operaciones en momentos de mayor volatilidad, como la apertura y el cierre del mercado.
Resumir
La estrategia combina los indicadores RSI y MACD, junto con condiciones de entrada flexibles y mecanismos de control de riesgo, para construir un sistema de negociación relativamente completo. Si bien hay algunos lugares que necesitan ser optimizados, el marco básico tiene una buena escalabilidad y, con mayor optimización y perfección, se espera que se convierta en una estrategia de negociación más sólida.
- 1