Estrategia cuantitativa de mapa de calor de centro de liquidez de múltiples períodos

Descripción general
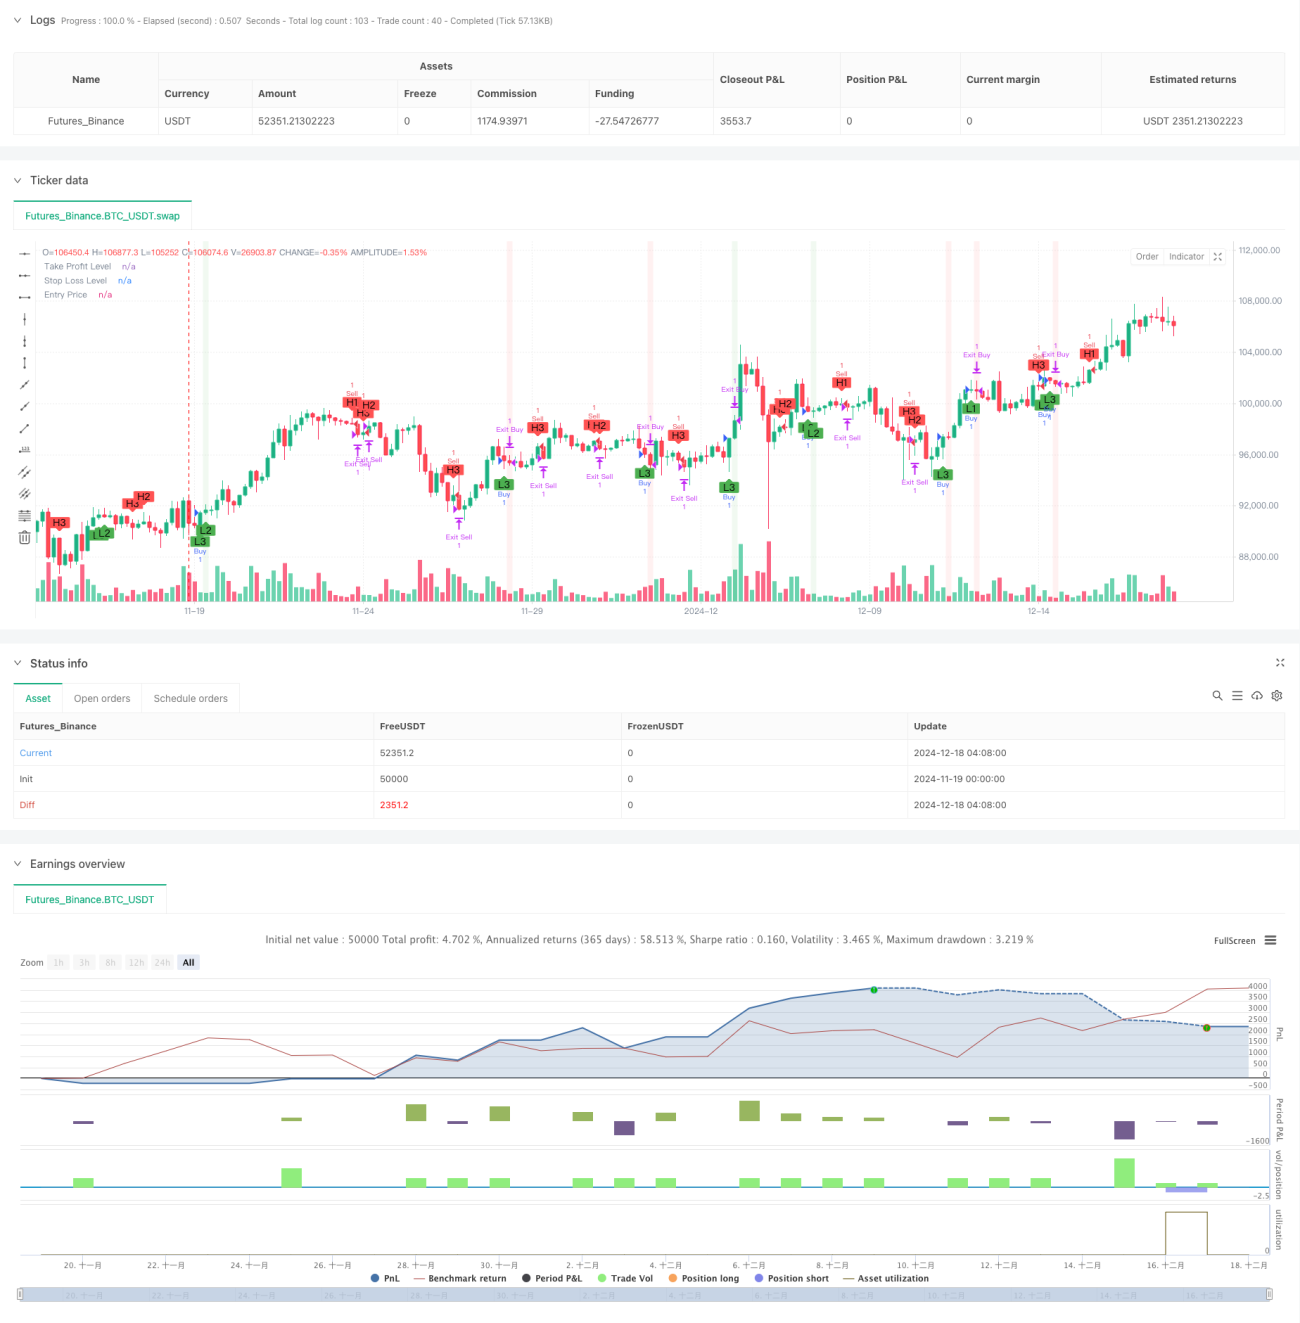
La estrategia es un sistema de negociación cuantitativa basado en detección de puntos centrales de fluidez en múltiples períodos de tiempo. Identifica los niveles clave de soporte y resistencia mediante el análisis del comportamiento de los precios en tres períodos de tiempo diferentes: 15 minutos, 1 hora y 4 horas, y toma decisiones de negociación sobre esta base. El sistema integra funciones de administración de fondos, incluida la configuración de paradas y pérdidas de montos fijos, al tiempo que proporciona retroalimentación visual intuitiva para ayudar a los operadores a comprender mejor la estructura del mercado.
Principio de estrategia
El núcleo de la estrategia es detectar los puntos centrales de los precios en varios períodos de tiempo a través de las funciones ta.pivothigh y ta.pivotlow. Para cada período de tiempo, el sistema utiliza la línea K de referencia izquierda y derecha (default 7) para determinar los puntos altos y bajos más significativos. Cuando se produce un nuevo punto mínimo central en un período de tiempo, el sistema genera una señal múltiple; cuando se produce un nuevo punto alto central, el sistema genera una señal de vacío.
Ventajas estratégicas
- El análisis de múltiples períodos de tiempo proporciona una visión más completa del mercado, lo que ayuda a capturar diferentes niveles de oportunidades de negociación.
- La lógica de transacción basada en nodos tiene una base sólida de análisis tecnológico para ser fácil de entender y ejecutar
- Funciones de gestión de fondos integradas para controlar eficazmente el riesgo de cada transacción
- La interfaz visual muestra de forma intuitiva el estado de las operaciones, incluida la posición, el nivel de stop loss y las zonas de pérdidas
- Los parámetros de la estrategia son ajustables, adaptables y se pueden optimizar según las diferentes condiciones del mercado
Riesgo estratégico
- Las señales de múltiples períodos de tiempo pueden tener conflictos y se necesita un mecanismo de prioridad de señal razonable.
- La cantidad fija de stop loss puede no ser adecuada para todas las condiciones del mercado y se recomienda que se ajuste a la dinámica de la volatilidad.
- El retraso en la detección en los nodos puede causar un retraso en el tiempo de entrada
- Durante las altas oscilaciones, puede haber falsas señales de ruptura.
- Hay que tener en cuenta las diferencias de fluidez en diferentes períodos de tiempo
Dirección de optimización de la estrategia
- Introducción de indicadores de volatilidad y ajuste dinámico del nivel de pérdidas de parada
- Mecanismos de confirmación de transacciones para mejorar la fiabilidad de los nodos
- Desarrollo de un sistema de prioridad de ciclo de tiempo para resolver conflictos de señales
- Integrar filtros de tendencias para evitar el exceso de comercio en mercados horizontales
- Considere agregar análisis de la estructura de precios para mejorar la precisión de la hora de entrada
Resumir
La estrategia de cuantificación de la energía térmica de los nodos de fluidez de múltiples ciclos de tiempo es un sistema de negociación estructurado, lógicamente claro. A través de un análisis de mercado multidimensional y una gestión estricta del riesgo, proporciona a los operadores un marco de negociación confiable. Aunque existen algunos riesgos y limitaciones inherentes, la estrategia se espera que mantenga un rendimiento estable en diversos entornos de mercado a través de la optimización y la mejora continuas.
/*backtest
start: 2024-11-19 00:00:00
end: 2024-12-18 08:00:00
period: 4h
basePeriod: 4h
exchanges: [{"eid":"Futures_Binance","currency":"BTC_USDT"}]
*/

// This Pine Script™ code is subject to the terms of the Mozilla Public License 2.0 at https://mozilla.org/MPL/2.0/
// © pmotta41
//@version=5
strategy("GPT Session Liquidity Heatmap Strategy", overlay=true)- 1