Estrategia cuantitativa de cruce de líneas de tendencia múltiples

Descripción general de la estrategia
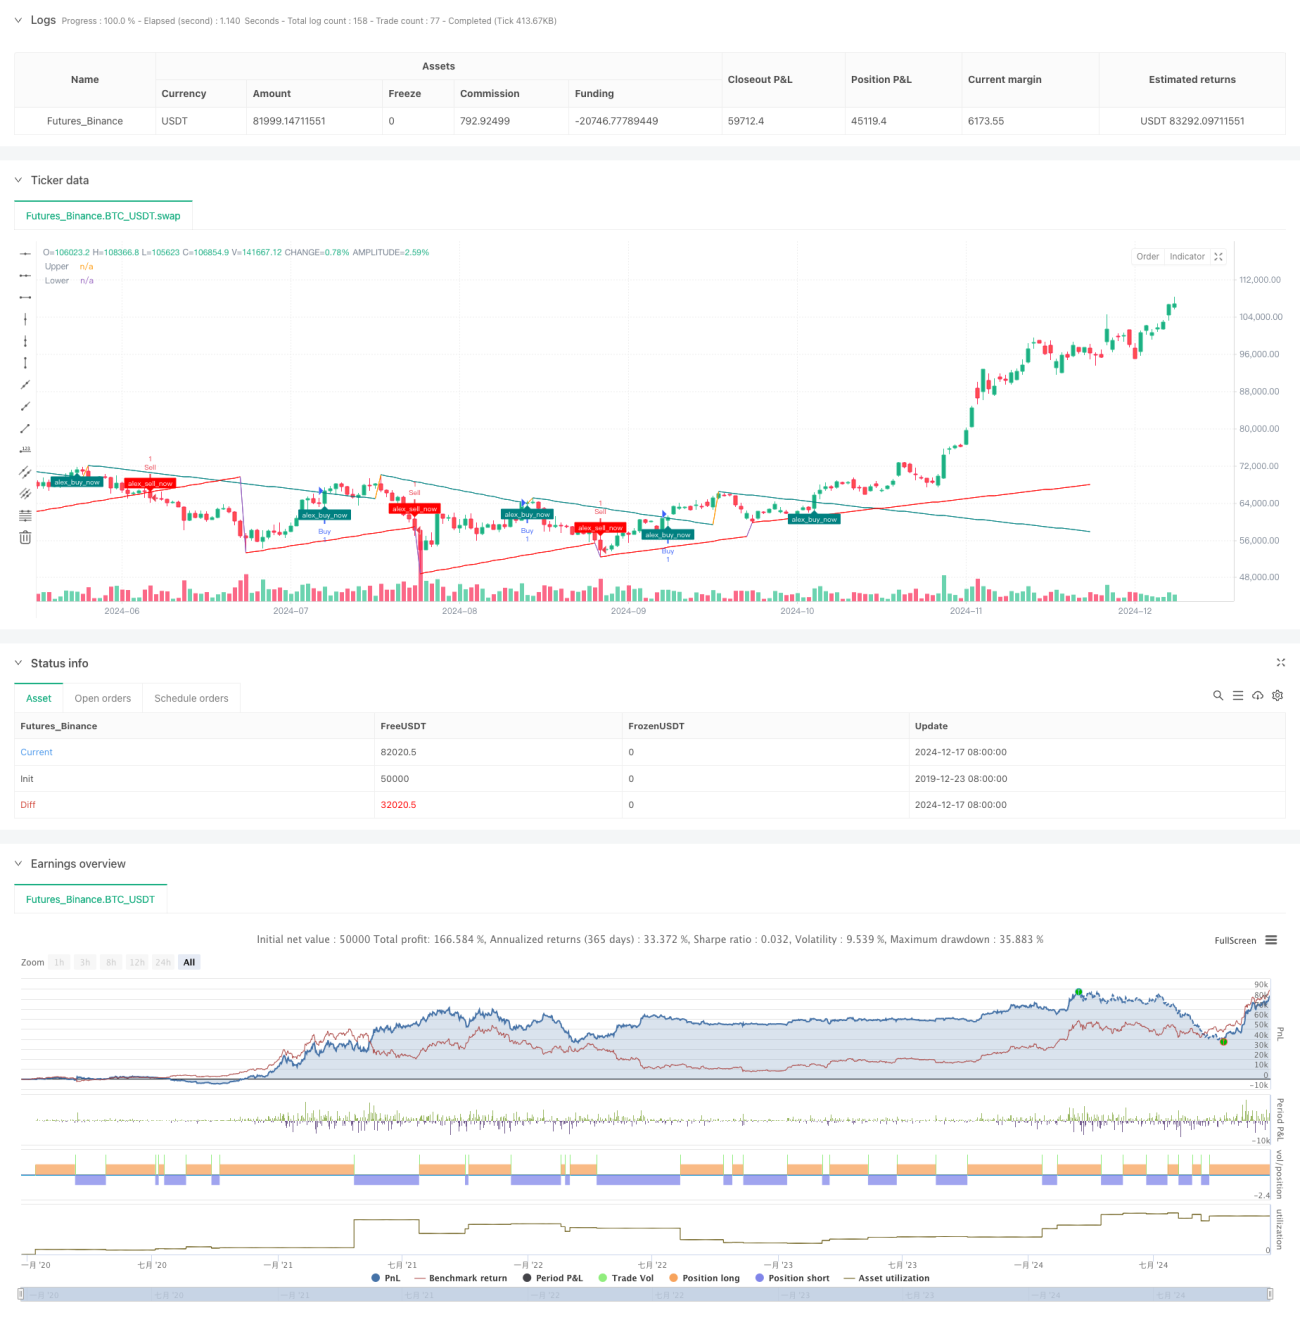
La estrategia es un sistema de negociación inteligente basado en múltiples rupturas de líneas de tendencia. Identifica dinámicamente los puntos de resistencia de soporte clave, calcula la inclinación de la línea de tendencia en combinación con varios indicadores técnicos y realiza operaciones cuando el precio rompe la línea de tendencia. La estrategia no solo puede capturar los puntos de inflexión de la tendencia del mercado, sino que también puede adaptarse a diferentes entornos del mercado mediante optimización de parámetros.
Principio de estrategia
La lógica central de la estrategia incluye tres partes principales: primero, identificar los puntos altos y bajos clave a través del período de retroceso (Lookback Period) para formar los puntos de resistencia de soporte inicial; segundo, calcular dinámicamente la pendiente de la línea de tendencia de acuerdo con el método de cálculo elegido (ATR, diferencia estándar o regresión lineal), lo que permite a la línea de tendencia adaptarse mejor a las fluctuaciones del mercado; y finalmente, activar una señal de negociación al ocurrir una ruptura mediante el monitoreo de la relación entre el precio y la línea de tendencia. El sistema también incluye un mecanismo para evitar que la retroalimentación sea demasiado simulada, para simular el entorno de negociación real mediante el backpainting de los parámetros.
Ventajas estratégicas
- Adaptabilidad: las estrategias pueden adaptarse a diferentes entornos de mercado a través de varios métodos de cálculo de pendientes y parámetros ajustables
- Control de riesgos perfeccionado: la capacidad de ajuste dinámico de las líneas de tendencia ayuda a identificar cambios en la tendencia a tiempo y reduce los daños causados por falsas rupturas
- Buena visualización: las estrategias proporcionan una clara retroalimentación visual, incluyendo extensiones de líneas de tendencia y marcas de ruptura
- Mecanismo de confirmación de señales: asegura la fiabilidad de las señales de negociación mediante la verificación de múltiples condiciones
Riesgo estratégico
- Las fuertes fluctuaciones en el mercado pueden generar falsas señales
- El retraso en el cálculo de la línea de tendencia puede causar un pequeño retraso en el tiempo de entrada
- Una mala selección de los parámetros puede conducir a una sobrecomercialización o a perder oportunidades importantes
- Las señales falsas de ruptura pueden ser frecuentes en los mercados de ordenamiento horizontal
Dirección de optimización de la estrategia
- Introducción de indicadores de tráfico para verificar la efectividad de las brechas
- Agrega un filtro de fluctuación del mercado para ajustar los parámetros durante la alta volatilidad
- Integración de otros indicadores técnicos para mejorar la precisión de la señal
- Desarrollo de mecanismos de ajuste de parámetros adaptativos
- El método de cálculo inteligente para incrementar el stop-loss y el profit-loss
Resumir
La estrategia utiliza una combinación de varios métodos de análisis técnico para construir un sistema de negociación robusto que rompe las líneas de tendencia. Su ventaja radica en su capacidad de adaptarse dinámicamente a los cambios en el mercado, al tiempo que proporciona una señal de negociación clara. Aunque existen algunos riesgos inherentes, la estabilidad y la rentabilidad de la estrategia se pueden mejorar significativamente con la configuración de parámetros razonables y la optimización continua.
/*backtest
start: 2019-12-23 08:00:00
end: 2024-12-18 08:00:00
period: 1d
basePeriod: 1d
exchanges: [{"eid":"Futures_Binance","currency":"BTC_USDT"}]
*/

// This Pine Script™ code is subject to the terms of the Mozilla Public License 2.0 at https://mozilla.org/MPL/2.0/
// © Alexgoldhunter

//@version=5- 1