
Resumen
Esta estrategia combina las bandas de Bollinger y el indicador triple SuperTrend para operar. A través de la determinación del rango de volatilidad de las bandas de Bollinger y la confirmación de tendencia del triple SuperTrend, se forma un sistema robusto de seguimiento de tendencia. Las bandas de Bollinger se utilizan para identificar movimientos extremos del precio, mientras que el triple SuperTrend proporciona múltiples confirmaciones de la dirección de la tendencia mediante diferentes configuraciones de parámetros. Solo se opera cuando todas las señales son coherentes, reduciendo así el riesgo de señales falsas. Este enfoque combinado conserva las ventajas del seguimiento de tendencia y aumenta la fiabilidad de las operaciones.
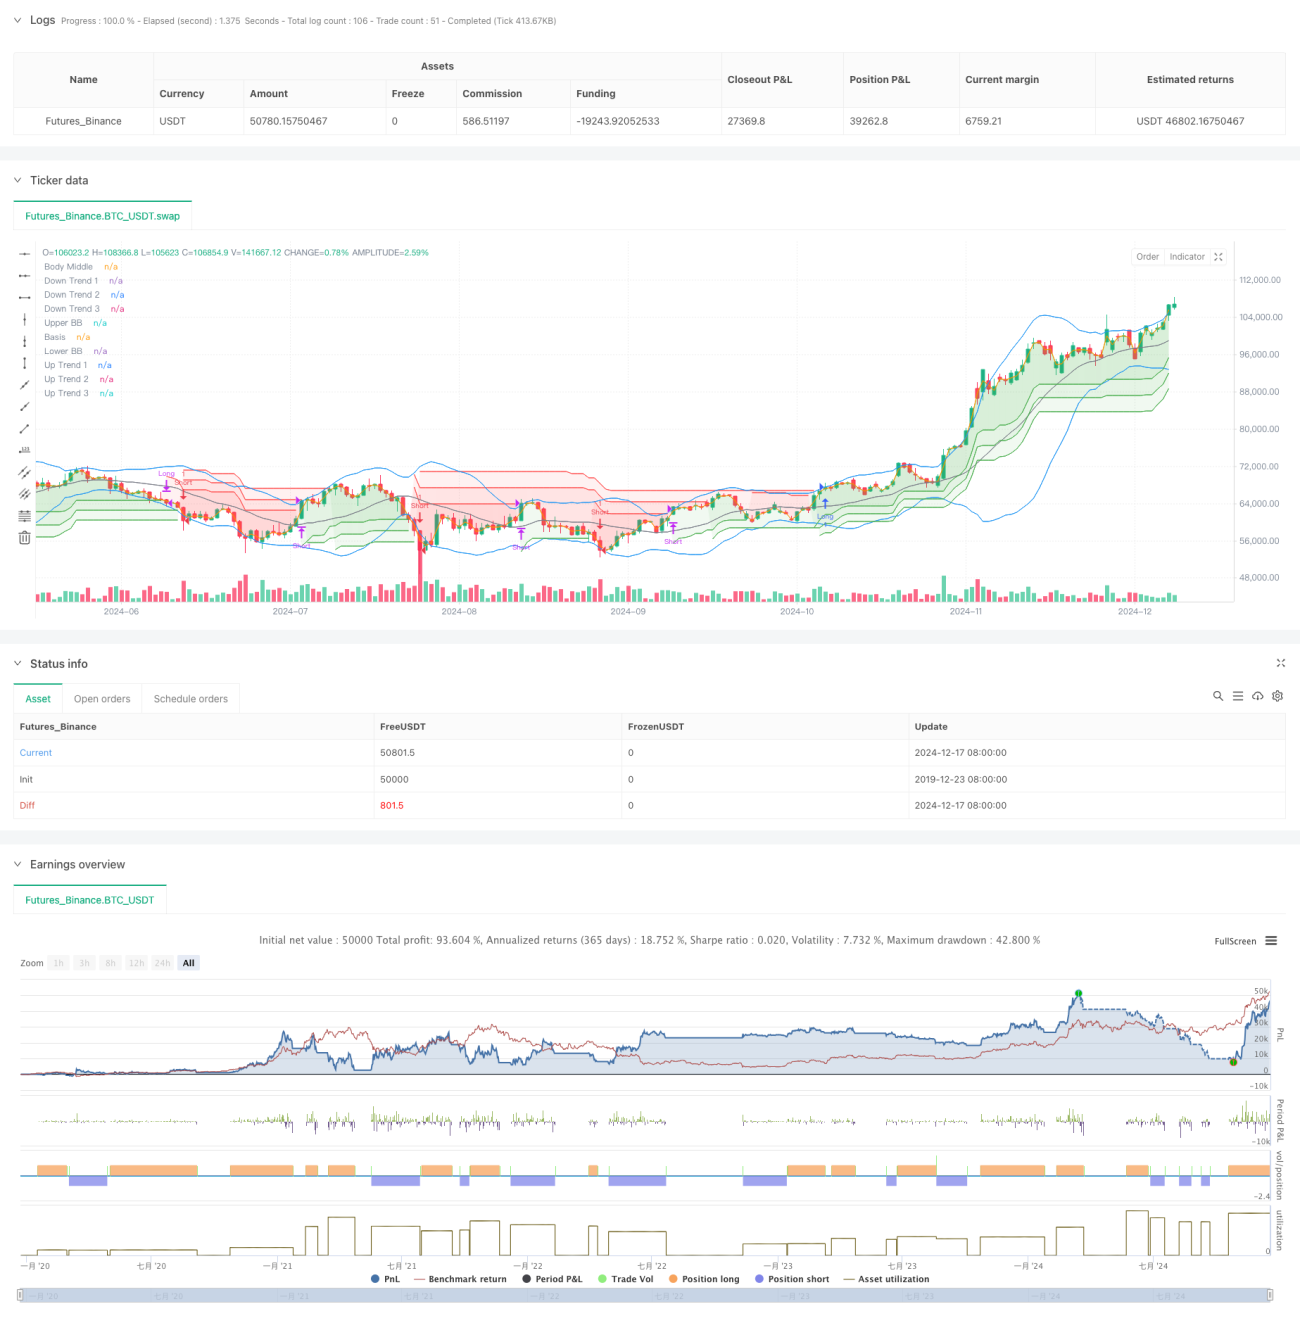
Principio de la estrategia
La lógica central de la estrategia incluye los siguientes componentes clave:
- Uso de bandas de Bollinger de 20 períodos con un multiplicador de desviación estándar de 2.0 para evaluar la volatilidad del precio.
- Configuración de tres líneas SuperTrend con períodos de 10 y parámetros de 3.0, 4.0 y 5.0 respectivamente.
- Condición de entrada larga: el precio supera la banda superior de Bollinger y las tres líneas SuperTrend muestran una tendencia alcista.
- Condición de entrada corta: el precio cae por debajo de la banda inferior de Bollinger y las tres líneas SuperTrend muestran una tendencia bajista.
- Cuando cualquiera de las líneas SuperTrend cambia de dirección, se cierra la posición actual.
- Se utiliza la línea de precio medio como referencia visual para mejorar la claridad.
Ventajas de la estrategia
- Mecanismo de confirmación múltiple: la combinación de bandas de Bollinger y triple SuperTrend reduce significativamente las señales falsas.
- Fuerte capacidad de seguimiento de tendencia: los parámetros progresivos del indicador SuperTrend permiten capturar eficazmente tendencias de diferentes niveles.
- Control de riesgos sólido: cierre rápido de posiciones ante indicios de cambio de tendencia, limitando las pérdidas.
- Alta flexibilidad de parámetros: todos los parámetros de los indicadores pueden optimizarse según las características del mercado.
- Alto grado de automatización: la lógica de la estrategia es clara, facilitando su implementación sistemática.
Riesgos de la estrategia
- Riesgo en mercados laterales: en mercados oscilantes, pueden generarse frecuentes señales de ruptura falsas.
- Impacto del deslizamiento: durante períodos de alta volatilidad, pueden ocurrir pérdidas significativas por deslizamiento.
- Riesgo de retraso: el mecanismo de confirmación múltiple puede provocar entradas tardías.
- Sensibilidad a los parámetros: diferentes combinaciones de parámetros pueden dar lugar a grandes variaciones en el rendimiento.
- Dependencia del entorno de mercado: la estrategia se desempeña mejor en mercados con tendencia clara.
Direcciones de optimización
- Incorporar indicadores de volumen: confirmar la validez de las rupturas de precio mediante el volumen.
- Optimizar el mecanismo de stop loss: añadir stops dinámicos o basados en ATR.
- Añadir filtro temporal: prohibir operaciones en ciertos periodos para evitar movimientos ineficientes.
- Incluir filtro de volatilidad: ajustar el tamaño de la posición o detener operaciones durante periodos de volatilidad excesiva.
- Desarrollar un mecanismo de parámetros adaptativos: ajustar los parámetros dinámicamente según las condiciones del mercado.
Conclusión
Esta es una estrategia de seguimiento de tendencia que combina bandas de Bollinger y triple SuperTrend, aumentando la fiabilidad de las operaciones mediante la confirmación de múltiples indicadores técnicos. La estrategia posee una fuerte capacidad para capturar tendencias y controlar riesgos, pero también es necesario prestar atención al impacto del entorno de mercado en su rendimiento. Mediante una optimización y mejora continuas, se espera que la estrategia mantenga un rendimiento estable en diferentes condiciones de mercado. Se recomienda realizar pruebas retrospectivas exhaustivas y optimización de parámetros antes de operar en vivo, y ajustar adecuadamente según la situación real del mercado.
//@version=5
strategy("Demo GPT - Bollinger + Triple Supertrend Combo", overlay=true, commission_type=strategy.commission.percent, commission_value=0.1, slippage=3)

// -------------------------------
// User Input for Date Range
// -------------------------------
startDate = input(title="Start Date", defval=timestamp("2018-01-01 00:00:00"))
endDate   = input(title="End Date",   defval=timestamp("2069-12-31 23:59:59"))

// -------------------------------
// Bollinger Band Inputs
// -------------------------------- 1