
Descripción general
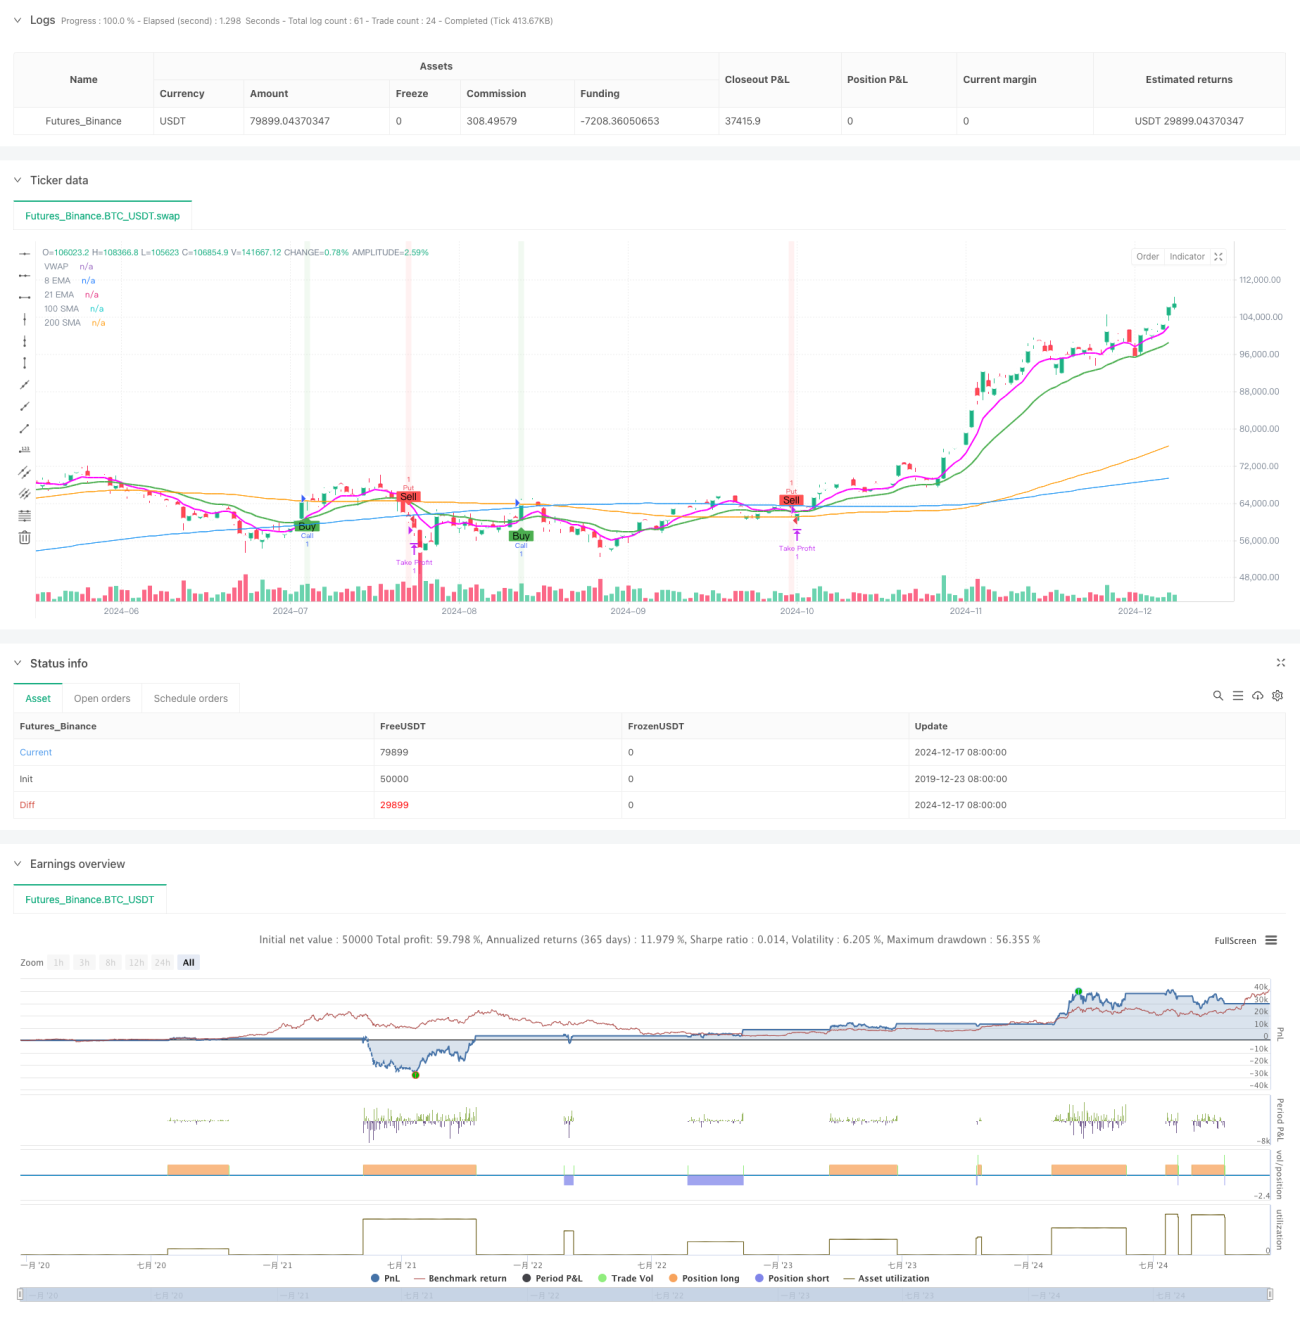
La estrategia es una estrategia de comercio de opciones de seguimiento de tendencias basada en una combinación de varios indicadores técnicos. Utiliza principalmente el cruce de EMA como señal central, en combinación con la dirección de la tendencia confirmada por SMA, VWAP, mientras que utiliza MACD y RSI como indicadores auxiliares para filtrar la señal.
Principio de estrategia
La estrategia utiliza el cruce de los EMA de 8 y 21 ciclos como su principal señal de negociación, y hace múltiples señales cuando el EMA de corto plazo atraviesa el EMA de largo plazo y cumple con las siguientes condiciones: el precio está por encima del SMA de 100 y 200 ciclos, la línea MACD está por encima de la línea de señal y el RSI es mayor que 50. Las condiciones de activación de las señales de brecha son las opuestas. La estrategia introduce VWAP como referencia de peso de precio para ayudar a determinar la posición relativa del precio actual.
Ventajas estratégicas
- Colaboración de múltiples indicadores para mejorar la fiabilidad de la señal mediante la verificación cruzada de diferentes ciclos y tipos de indicadores
- El uso de la combinación de seguimiento de tendencias y indicadores de movimiento para capturar tendencias y centrarse en la dinámica a corto plazo
- Los puntos de parada fijos ayudan a proteger las ganancias y evitar la avaricia excesiva
- Estricto manejo de las posiciones para evitar la reapertura y reducir la exposición al riesgo
- Visualizaciones claras, con movimientos EMA, SMA, VWAP y marcas de señales
Riesgo estratégico
- En mercados volátiles pueden producirse señales falsas frecuentes
- Los puntos de parada fijos pueden hacer que se pierdan oportunidades de ganancias mayores
- No hay un límite de pérdidas y puede sufrir grandes pérdidas en situaciones extremas
- El uso de múltiples indicadores puede causar un retraso en la señal
- En los contratos de opciones con poca liquidez, puede haber riesgo de deslizamiento
Dirección de optimización de la estrategia
- Introducción de un mecanismo de stop-loss adaptativo que se ajuste a las dinámicas de la volatilidad del mercado
- Aumentar el módulo de gestión de volúmenes y ajustar posiciones de forma dinámica en función del tamaño de la cuenta y las condiciones del mercado
- Agrega un filtro de fluctuación del mercado para ajustar los parámetros de la estrategia en un entorno de alta volatilidad
- Optimización de los parámetros del indicador, se puede considerar el uso de ciclos de adaptación en lugar de ciclos fijos
- Aumentar los filtros de tiempo para evitar operaciones en momentos de mayor volatilidad como el inicio y el final de los mercados
Resumir
Esta es una estrategia de comercio de opciones de seguimiento de tendencias de múltiples indicadores estructurada y lógica. La estrategia mejora la fiabilidad de la señal de comercio mediante la combinación de varios indicadores técnicos y utiliza puntos de parada fijos para administrar el riesgo. Aunque la estrategia tiene algunos riesgos inherentes, la orientación de optimización propuesta puede mejorar aún más la estabilidad y la rentabilidad de la estrategia.
/*backtest
start: 2019-12-23 08:00:00
end: 2024-12-18 08:00:00
period: 1d
basePeriod: 1d
exchanges: [{"eid":"Futures_Binance","currency":"BTC_USDT"}]
*/

//@version=5
strategy("OptionsMillionaire Strategy with Take Profit Only", overlay=true, default_qty_type=strategy.fixed, default_qty_value=1)

// Define custom magenta color- 1