Estrategia de tendencia de onda de seguimiento dinámico

Descripción general
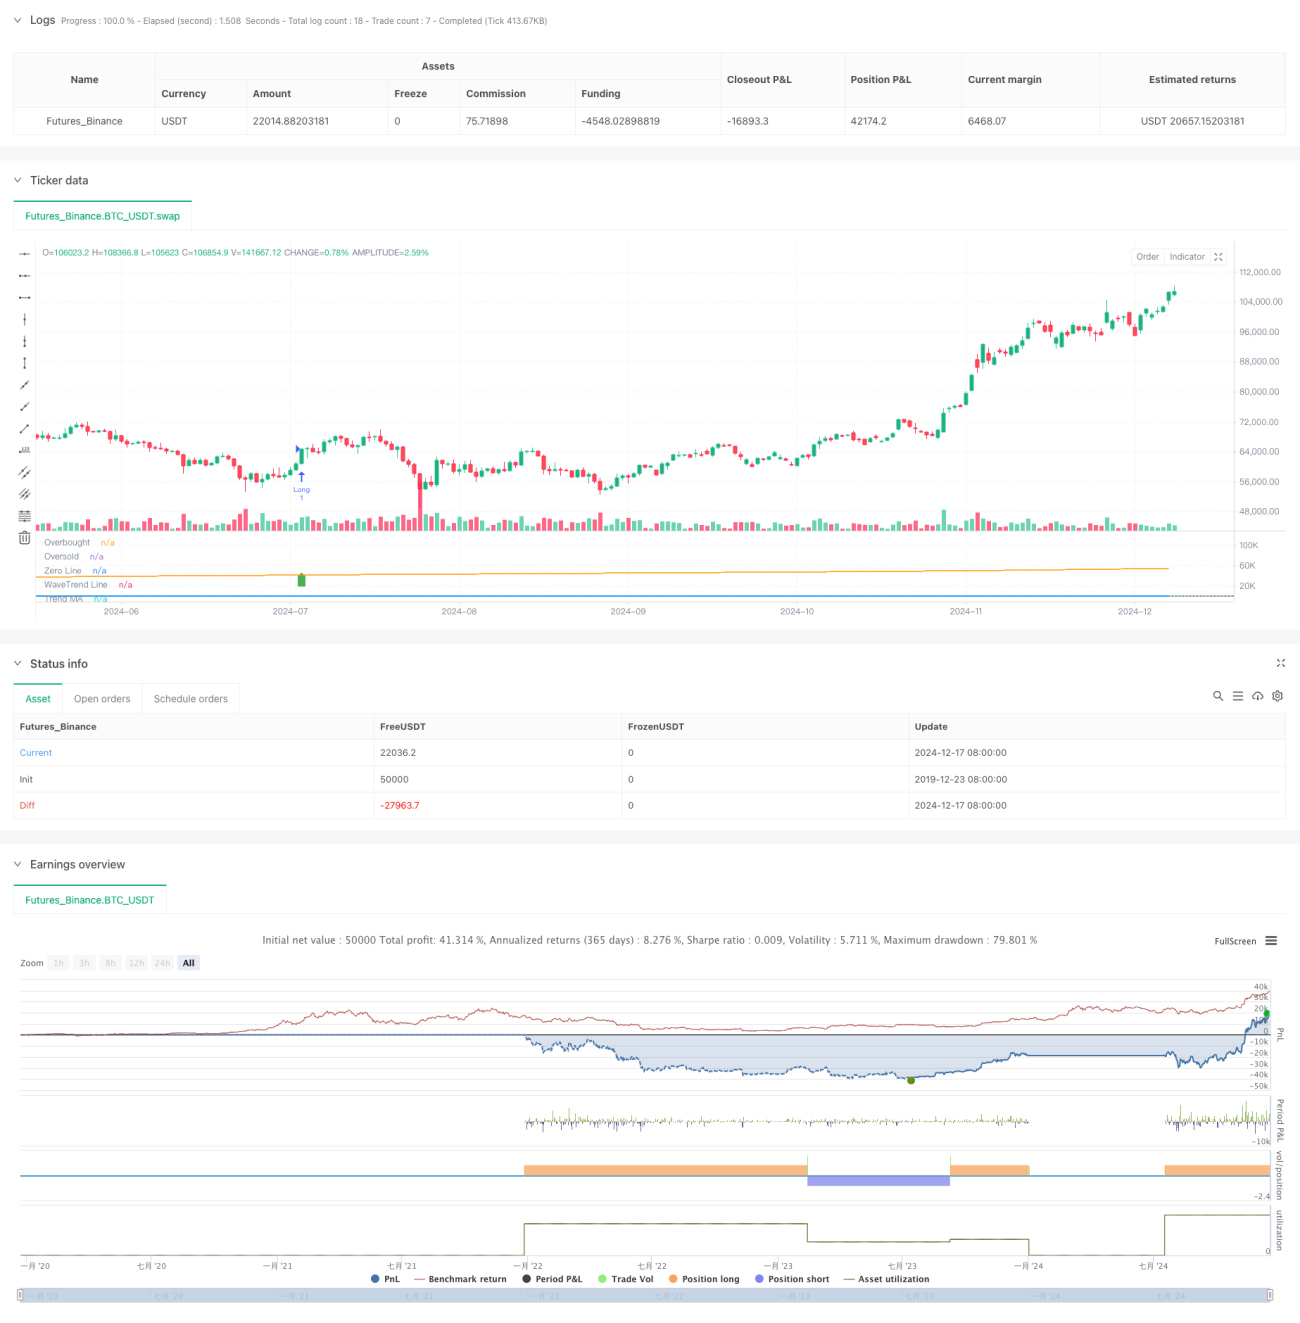
La estrategia es un sistema de trading cuantitativo basado en indicadores de WaveTrend y seguimiento de tendencias. Combina los indicadores de WaveTrend con las medias móviles para formar un marco de decisión de trading completo. La estrategia utiliza EMA y SMA para calcular el valor de la tendencia de las olas y la tendencia general del mercado, para identificar los puntos de inflexión del mercado mediante el establecimiento de un umbral de sobreventa y sobreventa, y para mejorar la precisión de la negociación en combinación con un filtro de tendencias.
Principio de estrategia
El núcleo de la estrategia se desarrolla a través de los siguientes pasos:
- Primero se calcula el precio promedio de HLC (la media de los precios máximos, mínimos y finales)
- Se obtiene la línea ESA usando la EMA para el tratamiento suavizado del promedio de HLC
- Calcular la desviación entre el promedio de HLC y la línea de la ESA y la suavización con EMA
- Calcular el valor de K sobre la base de la desviación y obtener la línea TCI final con dos suavizaciones de EMA
- Utilizando las SMA para calcular las líneas de tendencia a largo plazo como filtros de tendencia
- Cuando la línea TCI supera el nivel de sobreventa y se ajusta a la dirección de la tendencia, genera una señal de negociación
Ventajas estratégicas
- Alta fiabilidad de la señal: reduce efectivamente las falsas señales mediante la combinación de indicadores WaveTrend y filtros de tendencias
- Control de riesgo: establece un límite claro de sobreventa y sobreventa para ayudar a detener los pérdidas a tiempo
- Adaptabilidad: los parámetros de la estrategia se pueden ajustar con flexibilidad según las diferentes condiciones del mercado
- Logía de operación clara: las condiciones de entrada y salida son claras y fáciles de ejecutar
- Análisis integrado: toma en cuenta las fluctuaciones a corto plazo y las tendencias a largo plazo, lo que mejora la estabilidad de las operaciones
Riesgo estratégico
- Riesgo de cambio de tendencia: la posibilidad de retraso en un mercado muy volátil
- Sensibilidad de los parámetros: diferentes combinaciones de parámetros pueden dar lugar a resultados completamente diferentes
- Adaptabilidad del mercado: puede generar operaciones frecuentes en mercados convulsionados
- Gestión de fondos: control razonable de las posiciones para hacer frente a las fluctuaciones del mercado
- Dependencia tecnológica: los indicadores de dependencia tecnológica pueden pasar por alto factores fundamentales
Dirección de optimización de la estrategia
- Añadir filtro de volatilidad: ajustar el umbral de negociación en períodos de alta volatilidad
- Introducción de análisis multi-periódico: mejora de la precisión de las señales combinadas con diferentes períodos de tiempo
- Adaptación de los parámetros de optimización: ajuste de los parámetros del indicador en función de la situación dinámica del mercado
- Mejorar el frenado de pérdidas: aumentar el mecanismo de frenado dinámico
- Adición de confirmación de tráfico: combinación de análisis de tráfico para mejorar la fiabilidad de la señal
Resumir
La estrategia, mediante una combinación ingeniosa de indicadores de WaveTrend y filtros de tendencias, construye un sistema de negociación sólido. La estrategia permite un análisis completo del mercado mientras se mantiene la simplicidad de la operación. Aunque existe cierto riesgo, la estrategia tiene un buen valor de uso y potencial de desarrollo con una gestión razonable del riesgo y una optimización continua.
- 1