Descripción general
La estrategia es un sistema de comercio de seguimiento de tendencias avanzado combinado con tecnología de inteligencia artificial, que integra principalmente el indicador de desviación VPS (sistema de precios de fluctuación) y el método de tendencia WOW. Utiliza el VPS para identificar la volatilidad del mercado y la fuerza de la tendencia, mientras que combina el desvío RSI para detectar posibles reveses de precios.
Principio de estrategia
La estrategia se basa en tres componentes centrales:
- El indicador de tendencia WOW se utiliza para confirmar el cambio de tendencia (de la cabecera a la cabecera o viceversa)
- Las condiciones VPS se utilizan para verificar la volatilidad y la fuerza de la tendencia
- El análisis de desviación del RSI para identificar posibles puntos de inflexión
El sistema primero calcula el canal de resistencia de soporte dinámico basado en el ATR, en combinación con el parámetro de longitud de VPS (default 11) para evaluar el estado del mercado. Cuando el precio supera el nivel de sobrecompra (default 78) o el nivel de sobreventa (default 27), el sistema dispara una señal de negociación. Al mismo tiempo, la estrategia también monitorea el desvío entre el precio y el indicador de VPS para confirmar la dirección de la operación.
Ventajas estratégicas
- Análisis multidimensional: proporciona una visión más completa del mercado mediante la combinación de seguimiento de tendencias, volatilidad y análisis de desviaciones
- Adaptabilidad: utiliza un canal ATR dinámico que se ajusta automáticamente a la volatilidad del mercado
- Gestión de riesgos: un mecanismo de stop-loss incorporado que automáticamente cancela las posiciones en función de los objetivos de ganancias predeterminados
- Mecanismo de confirmación de señales: requiere que se cumplan varias condiciones simultáneamente para que se active una transacción, reduciendo la posibilidad de señales falsas
- Capacidad de negociación bidireccional: captura de oportunidades de negociación bidireccionales y aprovecha las fluctuaciones del mercado
Riesgo estratégico
- Ruido de mercado: puede generar falsas señales en un entorno horizontal o de baja volatilidad
- Sensibilidad de los parámetros: la configuración de los parámetros indicadores (como la longitud de VPS, el nivel de sobrecompra y sobreventa) tiene un gran impacto en el rendimiento de la estrategia
- Riesgo de deslizamiento: puede haber un gran impacto de deslizamiento en operaciones de corto período (por ejemplo, 5 minutos)
- Retardo en la señal: el mecanismo de confirmación múltiple puede causar un retraso en el tiempo de entrada.
- Gestión de fondos: la forma en que se distribuyen los fondos fijos puede variar según las condiciones del mercado
Dirección de optimización de la estrategia
- Ajuste de parámetros dinámicos: se puede introducir un mecanismo de parámetros adaptativos para ajustar dinámicamente la longitud del VPS y los umbrales de sobrecompra y sobreventa según las condiciones del mercado
- Filtrado de entornos de mercado: agregar módulo de identificación de entornos de mercado para suspender el comercio en condiciones de mercado inadecuadas
- Optimización de la detención de pérdidas: se pueden diseñar mecanismos de detención de pérdidas más flexibles basados en ATR para mejorar la precisión del control de riesgos
- Optimización de segmentos: características para diferentes períodos de negociación, ajuste de los parámetros de la estrategia y las reglas de negociación
- Optimización de la gestión de fondos: Introducción de la gestión de posiciones dinámicas para ajustar el volumen de las operaciones en función de la volatilidad del mercado y las condiciones de pérdidas y ganancias
Resumir
Se trata de una estrategia de negociación integral que combina varios indicadores técnicos y métodos de análisis. Al combinar la tecnología de inteligencia artificial con la técnica tradicional de análisis, la estrategia puede ofrecer una alta precisión de negociación mientras se mantiene la estabilidad. La ventaja central de la estrategia reside en su mecanismo de confirmación de señales multicapa y su sistema de gestión de riesgos perfectado, mientras que el principal espacio de optimización reside en el ajuste dinámico de los parámetros y la identificación del entorno de mercado.
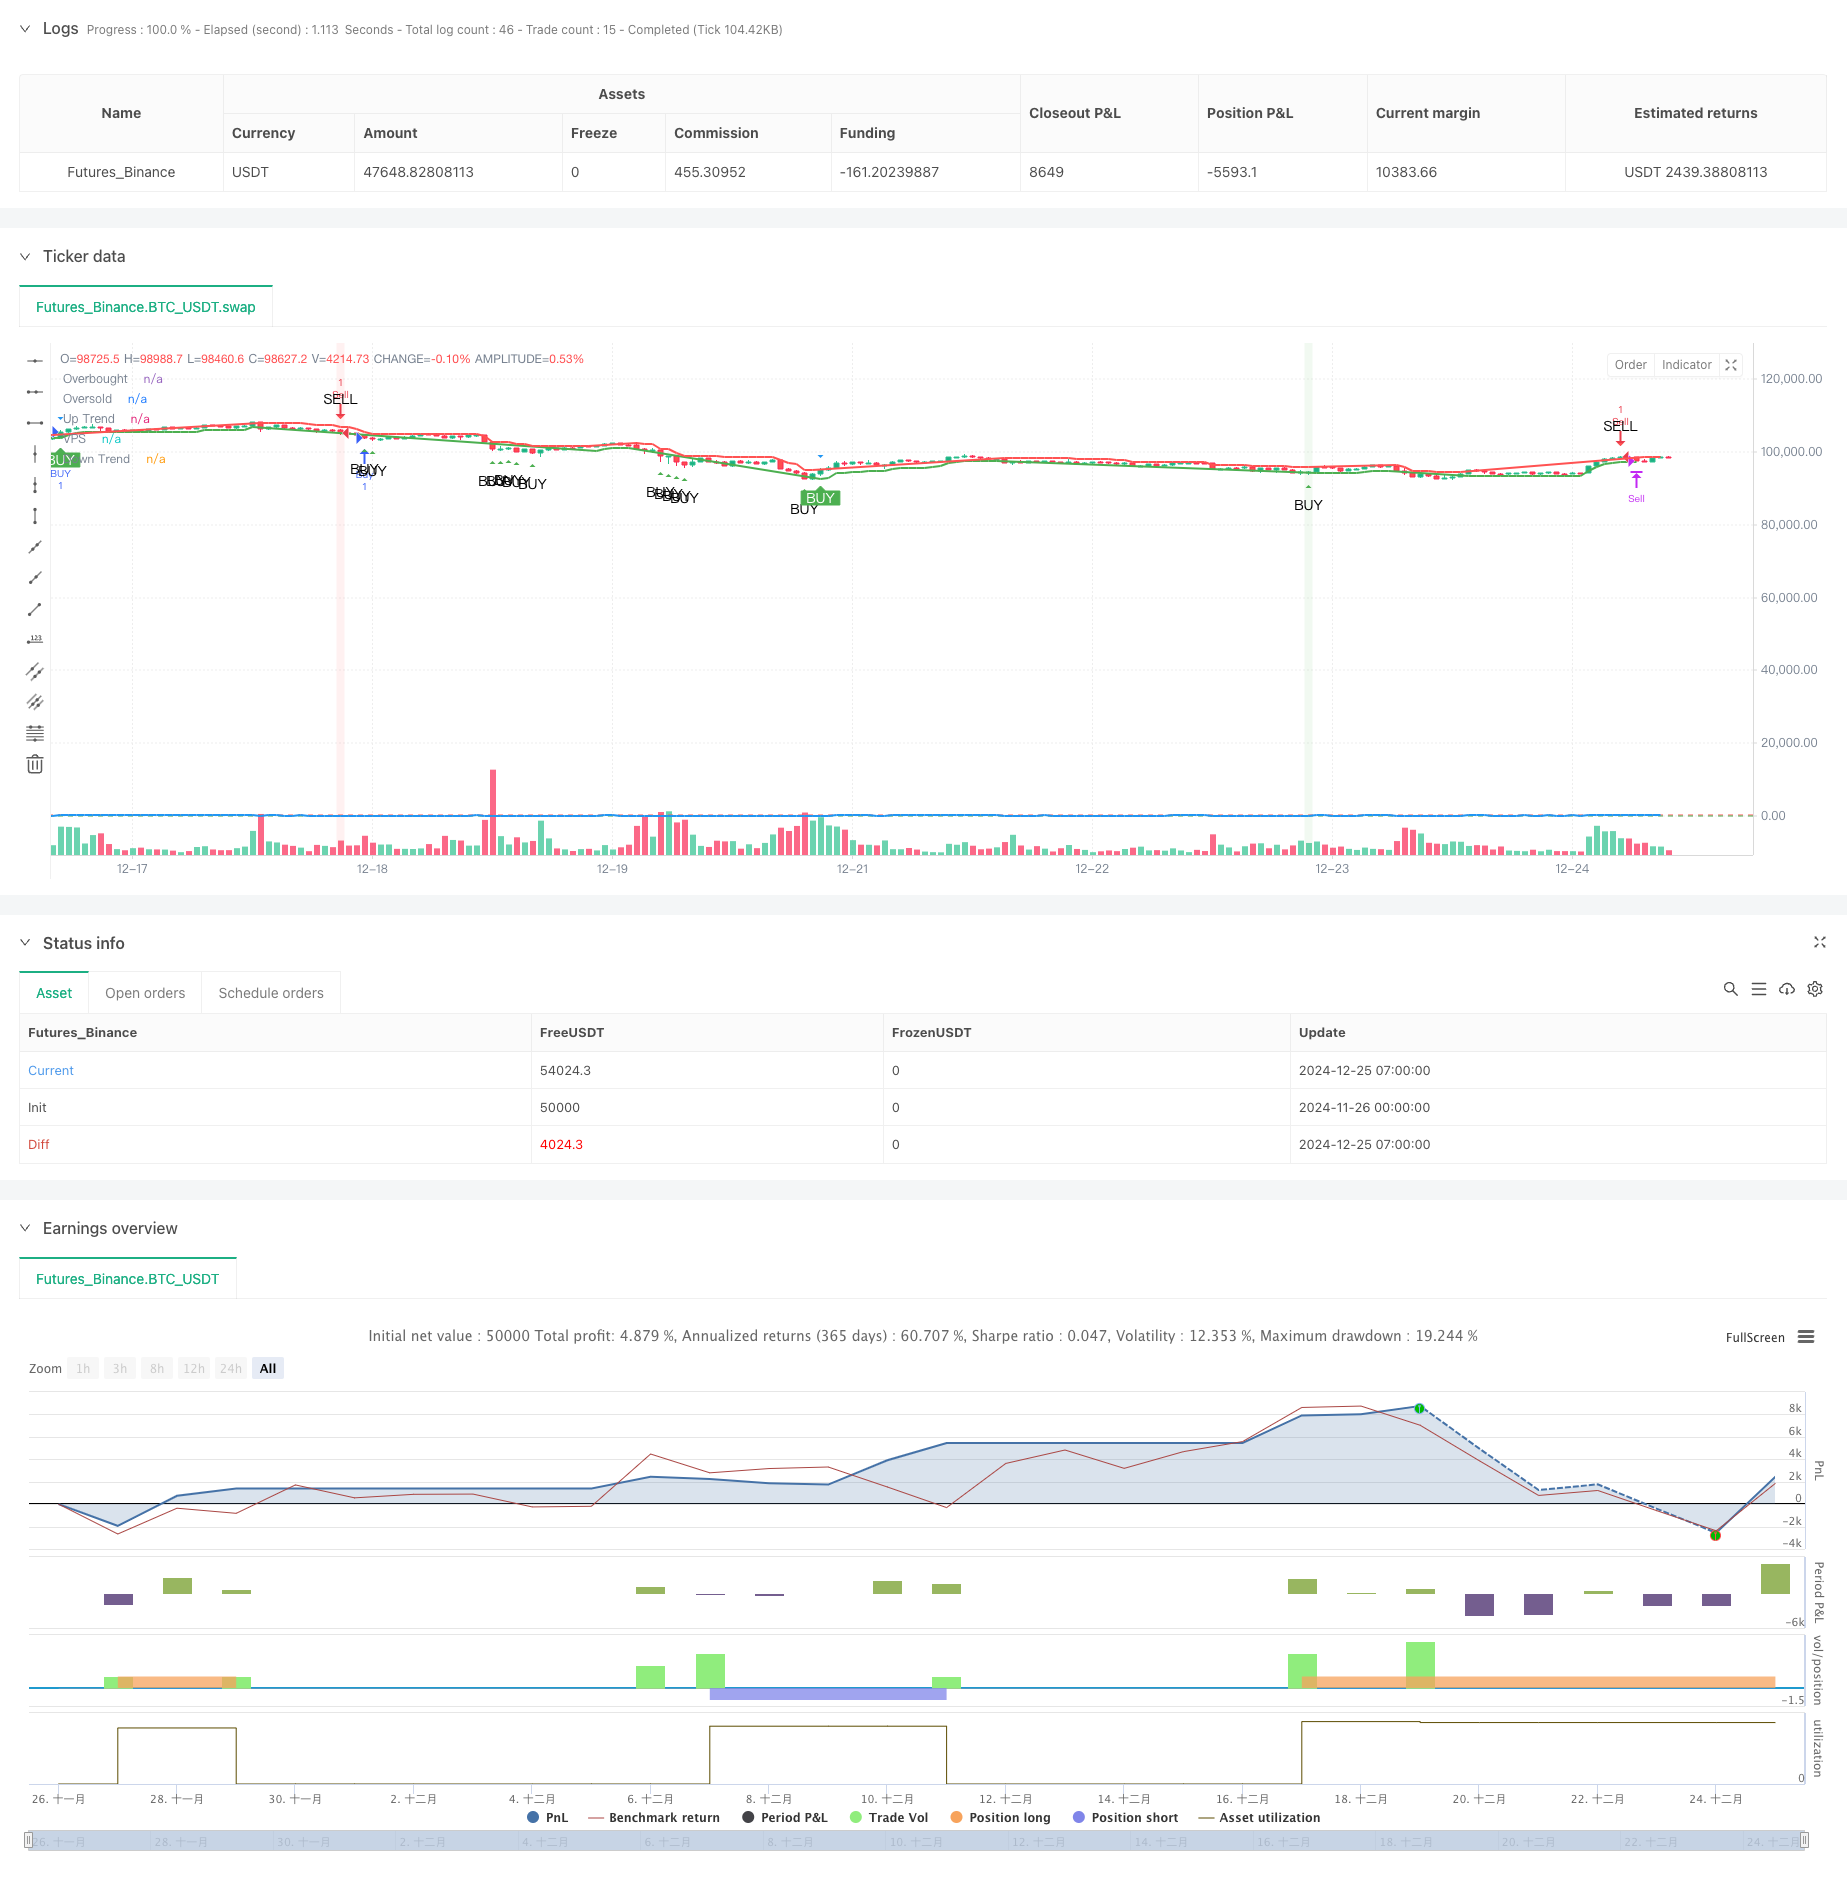
/*backtest
start: 2024-11-26 00:00:00
end: 2024-12-25 08:00:00
period: 1h
basePeriod: 1h
exchanges: [{"eid":"Futures_Binance","currency":"BTC_USDT"}]
*/

//@version=6
strategy("AI+VPS Vijay Prasad Strategy", overlay=true)

// --- VPS Divergence Strategy Inputs ---
vps_length = input.int(11, title="VPS Length")
vps_overbought = input.int(78, title="VPS Overbought Level")  // Overbought level for VPS
vps_oversold = input.int(27, title="VPS Oversold Level")  // Oversold level for VPS

// Calculate VPS (Relative Strength Index alternative) - here using a custom divergence condition
vps = ta.rsi(close, vps_length)

// Plot VPS on the chart
plot(vps, title="VPS", color=color.blue, linewidth=2)
hline(vps_overbought, "Overbought", color=color.red, linewidth=1)
hline(vps_oversold, "Oversold", color=color.green, linewidth=1)

// Define Buy and Sell Conditions based on Overbought/Oversold VPS
vps_buy_condition = vps < vps_oversold  // Buy signal when VPS is oversold
vps_sell_condition = vps > vps_overbought  // Sell signal when VPS is overbought

// Define Bullish and Bearish Divergence conditions
bullish_divergence = (low[1] < low[2] and vps[1] > vps[2] and low < low[1] and vps > vps[1])
bearish_divergence = (high[1] > high[2] and vps[1] < vps[2] and high > high[1] and vps < vps[1])

// Combine Buy and Sell signals:
// Buy when VPS is oversold or Bullish Divergence occurs
vps_buy_condition_final = vps_buy_condition or bullish_divergence
// Sell when VPS is overbought or Bearish Divergence occurs
vps_sell_condition_final = vps_sell_condition or bearish_divergence

// Plot Buy and Sell Signals
plotshape(series=vps_buy_condition_final, title="VPS Buy Signal", location=location.belowbar, color=color.green, style=shape.triangleup, text="BUY")
plotshape(series=vps_sell_condition_final, title="VPS Sell Signal", location=location.abovebar, color=color.red, style=shape.triangledown, text="SELL")

// VPS Divergence Highlight
bgcolor(bullish_divergence ? color.new(color.green, 90) : na)  // Highlight background for Bullish Divergence
bgcolor(bearish_divergence ? color.new(color.red, 90) : na)  // Highlight background for Bearish Divergence

// Strategy: Buy and Sell with target
if vps_buy_condition_final
    strategy.entry("Buy", strategy.long)

if vps_sell_condition_final
    strategy.entry("Sell", strategy.short)

// Capital settings for the strategy (for backtesting purposes)
capital_per_trade = input.float(1000, title="Capital per Trade (INR)", minval=1)
buy_target_inr = 1500  // Profit target for Buy in INR
sell_target_inr = 1000  // Profit target for Sell in INR

trade_value = close * (capital_per_trade / close)  // Value of one contract at current price

// Profit threshold calculation
buy_profit_target = buy_target_inr / trade_value  // Profit in price movement for Buy
sell_profit_target = sell_target_inr / trade_value  // Profit in price movement for Sell

// Exit based on profit targets
if strategy.position_size > 0
    profit_inr = (close - strategy.position_avg_price) * strategy.position_size
    if profit_inr >= buy_target_inr
        strategy.close("Buy", comment="Profit Target Reached")

if strategy.position_size < 0
    profit_inr = (strategy.position_avg_price - close) * -strategy.position_size
    if profit_inr >= sell_target_inr
        strategy.close("Sell", comment="Profit Target Reached")

// --- WoW Trends + VPS (Vijay Prasad Strategy) Logic ---
Periods = input.int(title="ATR Period", defval=10)
src = input.source(close, title="Source")
Multiplier = input.float(title="ATR Multiplier", step=0.1, defval=1.7)
changeATR = input.bool(title="Change ATR Calculation Method ?", defval=true)
showsignals = input.bool(title="Show Buy/Sell Signals ?", defval=true)

// --- ATR Calculation ---
atr2 = ta.sma(ta.tr, Periods)
atr = changeATR ? ta.atr(Periods) : atr2
up = src - (Multiplier * atr)
up1 = na(up[1]) ? up : up[1]
up := close[1] > up1 ? math.max(up, up1) : up
dn = src + (Multiplier * atr)
dn1 = na(dn[1]) ? dn : dn[1]
dn := close[1] < dn1 ? math.min(dn, dn1) : dn

// --- WoW Trends Logic ---
var trend = 1
trend := na(trend[1]) ? 1 : trend
trend := trend == -1 and close > dn1 ? 1 : trend == 1 and close < up1 ? -1 : trend

// --- VPS Logic (Vijay Prasad Strategy) ---
vpsVolatilityCondition = (high - low) > (1.5 * ta.sma(ta.tr, 20))  // VPS condition based on volatility
vpsTrendCondition = trend == 1  // VPS condition to check if trend is up
vpsSignal = vpsVolatilityCondition and vpsTrendCondition  // Combine both VPS conditions

// --- Buy/Sell Signal Logic ---
buySignal = trend == 1 and trend[1] == -1  // Signal to Buy (when trend switches to up)
sellSignal = trend == -1 and trend[1] == 1  // Signal to Sell (when trend switches to down)

// --- Combined Buy/Sell Signal Logic (WoW Trends + VPS) ---
combinedBuySignal = buySignal and vpsSignal
combinedSellSignal = sellSignal and vpsSignal

// --- Plot WoW Trends Lines using plot() ---
plot(trend == 1 ? up : na, title="Up Trend", color=color.green, linewidth=2)
plot(trend == -1 ? dn : na, title="Down Trend", color=color.red, linewidth=2)

// --- Plot VPS Signals ---
plotshape(vpsSignal and showsignals, title="VPS Signal", text="VPS", location=location.abovebar, style=shape.triangledown, size=size.small, color=color.blue, textcolor=color.white)

// --- Plot Combined Buy/Sell Signals ---
plotshape(combinedBuySignal and showsignals, title="Combined Buy Signal", text="BUY", location=location.belowbar, style=shape.labelup, size=size.small, color=color.green, textcolor=color.white)
plotshape(combinedSellSignal and showsignals, title="Combined Sell Signal", text="SELL", location=location.abovebar, style=shape.labeldown, size=size.small, color=color.red, textcolor=color.white)

// --- Strategy Entries ---
if (combinedBuySignal)
    strategy.entry("BUY", strategy.long)

if (combinedSellSignal)
    strategy.entry("SELL", strategy.short)

// --- Highlight Bars for Buy/Sell Signals ---
barcolor(combinedBuySignal ? color.green : na, offset=-1)
barcolor(combinedSellSignal ? color.red : na, offset=-1)