Estrategia de momentum adaptativa EMA-RSI multiestado combinada con un sistema de filtrado de índice de volatilidad

Descripción general
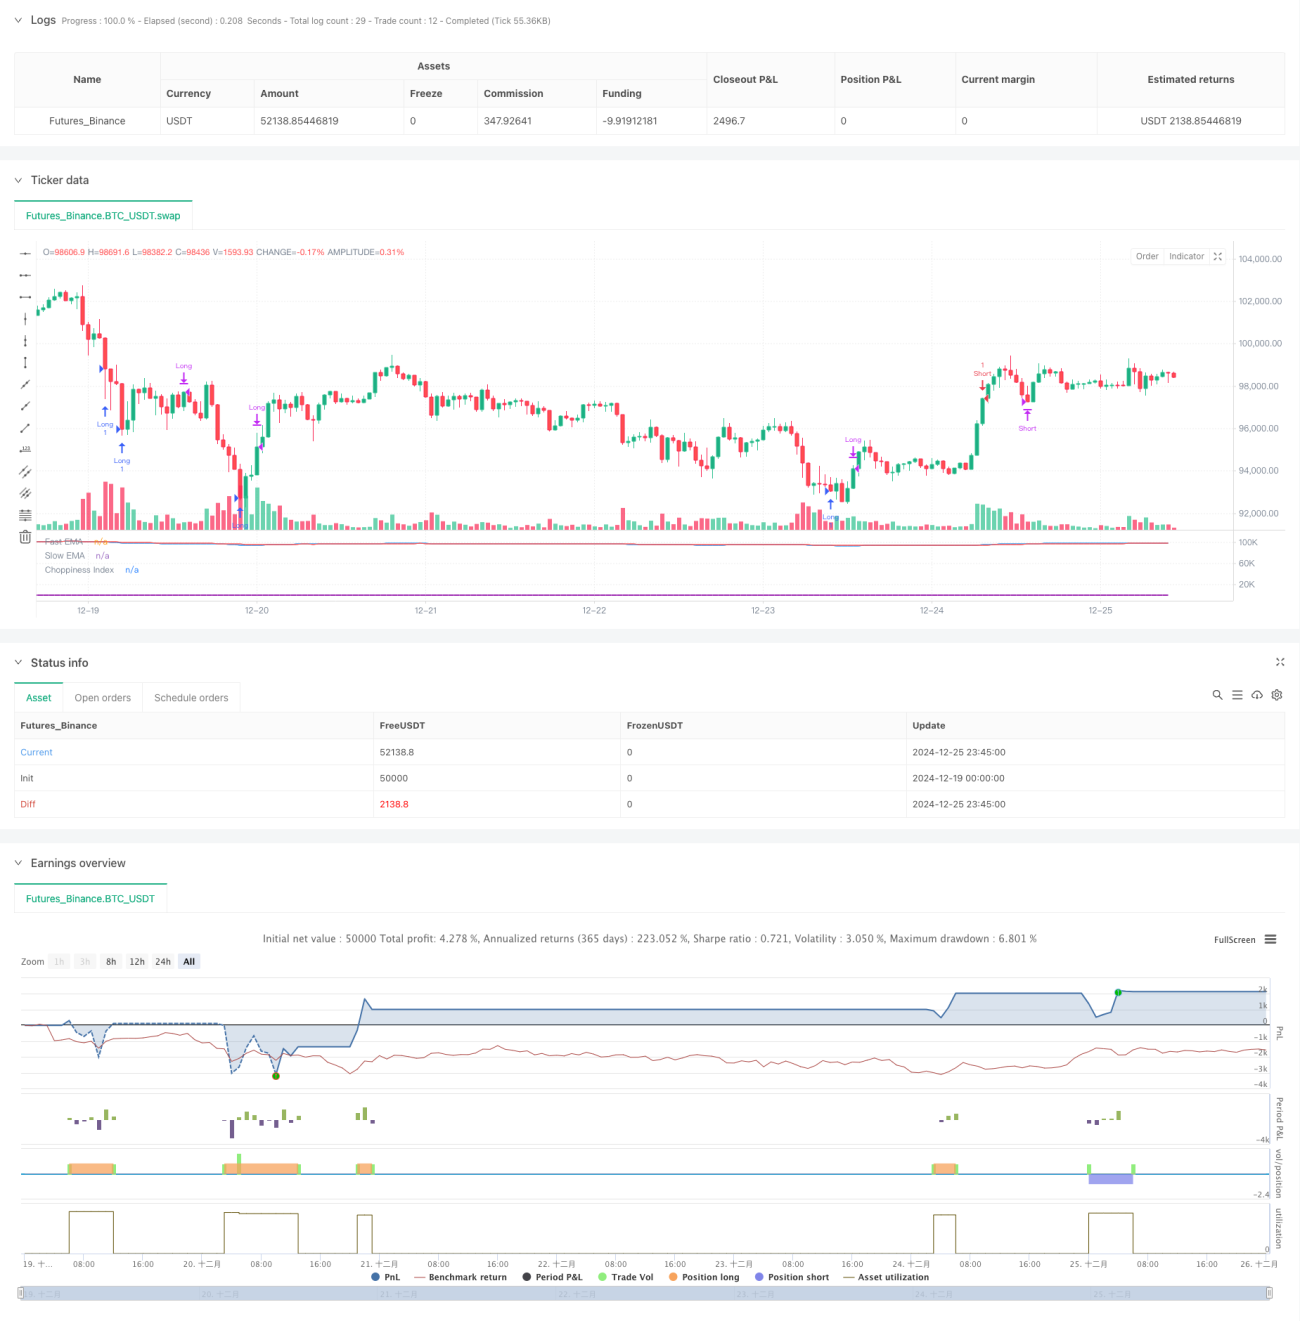
La estrategia es un sistema de auto-adaptación que combina el seguimiento de tendencias y el intercambio de intervalos para juzgar el estado del mercado a través del índice de fluctuación (CI) y adoptar la lógica de negociación correspondiente en función de las diferentes condiciones del mercado. En el mercado de tendencias, la estrategia utiliza la señal de venta por encima de la compra por encima de la venta de EMA y RSI; en el mercado de intervalos, la estrategia se opera principalmente en función del máximo valor del indicador RSI.
Principio de estrategia
El núcleo de la estrategia es dividir el mercado en un mercado de tendencia (CI <38.2) y un mercado intervalo (CI >61.8) a través del índice de fluctuación (CI). En un mercado de tendencia, se abren los polos cuando el EMA rápido (en el ciclo 9) atraviesa el EMA lento (en el ciclo 21) y el RSI está por debajo de 70. En un mercado intervalo, se abren los polos cuando el RSI está por debajo de 30 y por encima de 70.
Ventajas estratégicas
- Adaptabilidad al mercado: Identifica el estado del mercado a través de indicadores de CI y es capaz de cambiar estrategias de negociación con flexibilidad en diferentes entornos de mercado
- Confirmación de múltiples señales: combina la media móvil, el indicador de masa y el índice de oscilación para mejorar la fiabilidad de las señales de negociación
- Mejor gestión de riesgos: incluye un mecanismo de suspensión de pérdidas que permite controlar los riesgos de manera efectiva
- La lógica de negociación es clara: distingue tendencias y intervalos entre los dos estados del mercado, las reglas de negociación son claras
- Tasa de éxito más alta: muestra un 70-80% de éxito en un período de 15 minutos
Riesgo estratégico
- Sensibilidad a los parámetros: la estrategia utiliza varios indicadores técnicos y la optimización de los parámetros es más compleja
- Riesgo de brecha falsa: puede generar señales erróneas en la transición del estado del mercado
- Efecto de deslizamiento: en un entorno de mercado con poca liquidez, puede haber un mayor riesgo de deslizamiento
- Exceso de operaciones: los cambios frecuentes en el estado del mercado pueden conducir a exceso de operaciones
- Dependencia del mercado: el rendimiento de la estrategia puede verse afectado por condiciones específicas del mercado
Dirección de optimización de la estrategia
- Optimización de parámetros dinámicos: los parámetros del indicador se pueden ajustar según la dinámica de diferentes entornos de mercado
- Aumentar el filtro: añadir condiciones de filtrado como el volumen de tránsito, la fluctuación y mejorar la calidad de la señal
- Mecanismos de optimización de la pérdida: se puede considerar el uso de pérdidas dinámicas, como pérdidas ATR o pérdidas de seguimiento
- Mejora en la identificación de estados: subdivisiones de estados de mercado refinadas, aumento de la lógica de procesamiento de mercados neutros
- Desarrollo de sistemas de confirmación de señales: añadir más mecanismos de confirmación de señales y reducir las falsas señales
Resumir
La estrategia, mediante la combinación de varios indicadores técnicos, construye un sistema de negociación que se adapta a sí mismo y puede mantener un rendimiento estable en diferentes entornos de mercado. La ventaja central de la estrategia radica en su adaptabilidad al mercado y su mecanismo de gestión de riesgos, pero también debe tener en cuenta la optimización de los parámetros y la dependencia de las condiciones del mercado.
- 1