Estrategia de seguimiento de tendencias dinámicas de múltiples indicadores basada en EMA y SMA

Descripción general de la estrategia
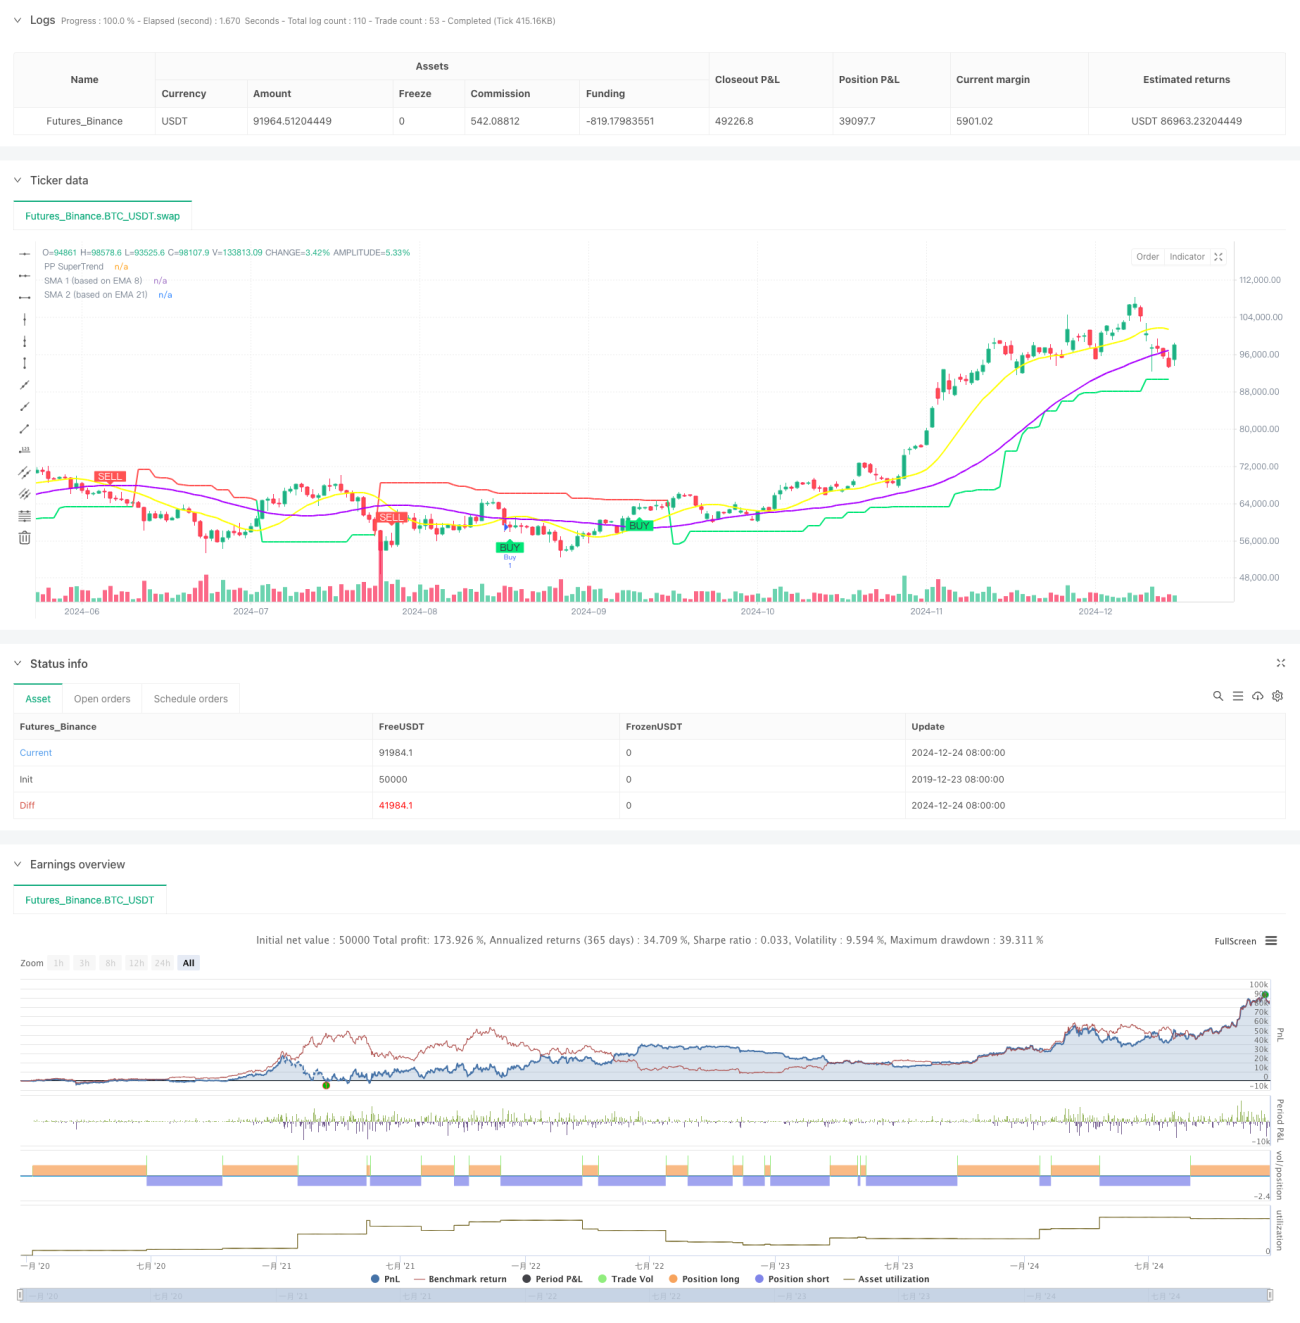
La estrategia es un sistema de seguimiento de tendencias dinámicas que combina múltiples indicadores técnicos. Identifica las tendencias del mercado y las oportunidades de negociación mediante la integración de señales cruzadas de puntos de pivote, indicadores de SuperTrend y promedios móviles. La característica central de la estrategia es el uso de un método de análisis de períodos de tiempo fijos para garantizar la consistencia de la señal, al tiempo que aumenta la fiabilidad de la señal de negociación mediante la verificación de los puntos de pivote.
Principio de estrategia
La estrategia opera sobre la base de los siguientes mecanismos básicos:
- El uso de datos de precios de períodos de tiempo fijos para el análisis, evitando la interferencia de diferentes períodos de tiempo
- El SMA se calcula a través de EMAs de 8 y 21 ciclos, formando la base para el seguimiento de tendencias
- Indicador de SuperTrend combinado con ATR y punto de referencia para determinar la dirección de la tendencia
- Las señales de cruce SMA que aparecen en el punto de apoyo en 3 períodos son consideradas como señales válidas
- Calculación dinámica y seguimiento de soporte/resistencia para la toma de decisiones comerciales
Ventajas estratégicas
- Verificación cruzada de múltiples indicadores para mejorar la fiabilidad de la señal
- Análisis de ciclo de tiempo fijo para reducir la interferencia de señales falsas
- Mecanismos de verificación punto a punto para garantizar que las transacciones se realicen a niveles de precios clave
- Seguimiento dinámico de soporte de resistencia para ayudar a determinar la posición de la parada de pérdida
- El uso de los indicadores SuperTrend proporciona una confirmación adicional de la dirección de la tendencia
- Ajuste de parámetros flexibles para adaptarse a las diferentes condiciones del mercado
Riesgo estratégico
- Múltiples indicadores pueden causar retraso en la señal
- Se podría generar demasiadas señales falsas en el mercado horizontal
- El análisis de períodos de tiempo fijos puede perder señales importantes de otros períodos
- El mecanismo de verificación de puntos de apoyo puede hacer que se pierdan oportunidades de negocio importantes.
- La optimización excesiva de los parámetros puede conducir a una sobreadaptación
Dirección de optimización de la estrategia
- Introducción de un mecanismo de filtrado de volatilidad para reducir la frecuencia de las transacciones durante la baja volatilidad
- Indicadores de confirmación de la fuerza de la tendencia, como el ADX o el MACD
- Desarrollar un sistema de parámetros de adaptación para ajustar los parámetros de forma dinámica en función de las condiciones del mercado
- Agregue análisis del volumen de operaciones para mejorar la confiabilidad de la señal
- Implementación de un mecanismo de parada dinámica para ajustar la posición de parada en función de las fluctuaciones del mercado
Resumir
La estrategia, a través de la combinación de múltiples indicadores técnicos, establece un sistema de comercio de seguimiento de tendencias relativamente completo. Su principal ventaja es mejorar la fiabilidad de la señal a través del análisis de períodos de tiempo fijos y la verificación de puntos de apoyo. Aunque existe un cierto riesgo de retraso, se puede controlar eficazmente mediante la optimización de parámetros y medidas de gestión de riesgos.
- 1