Estrategia de trading dinámico adaptativo basada en retornos logarítmicos normalizados

Descripción general
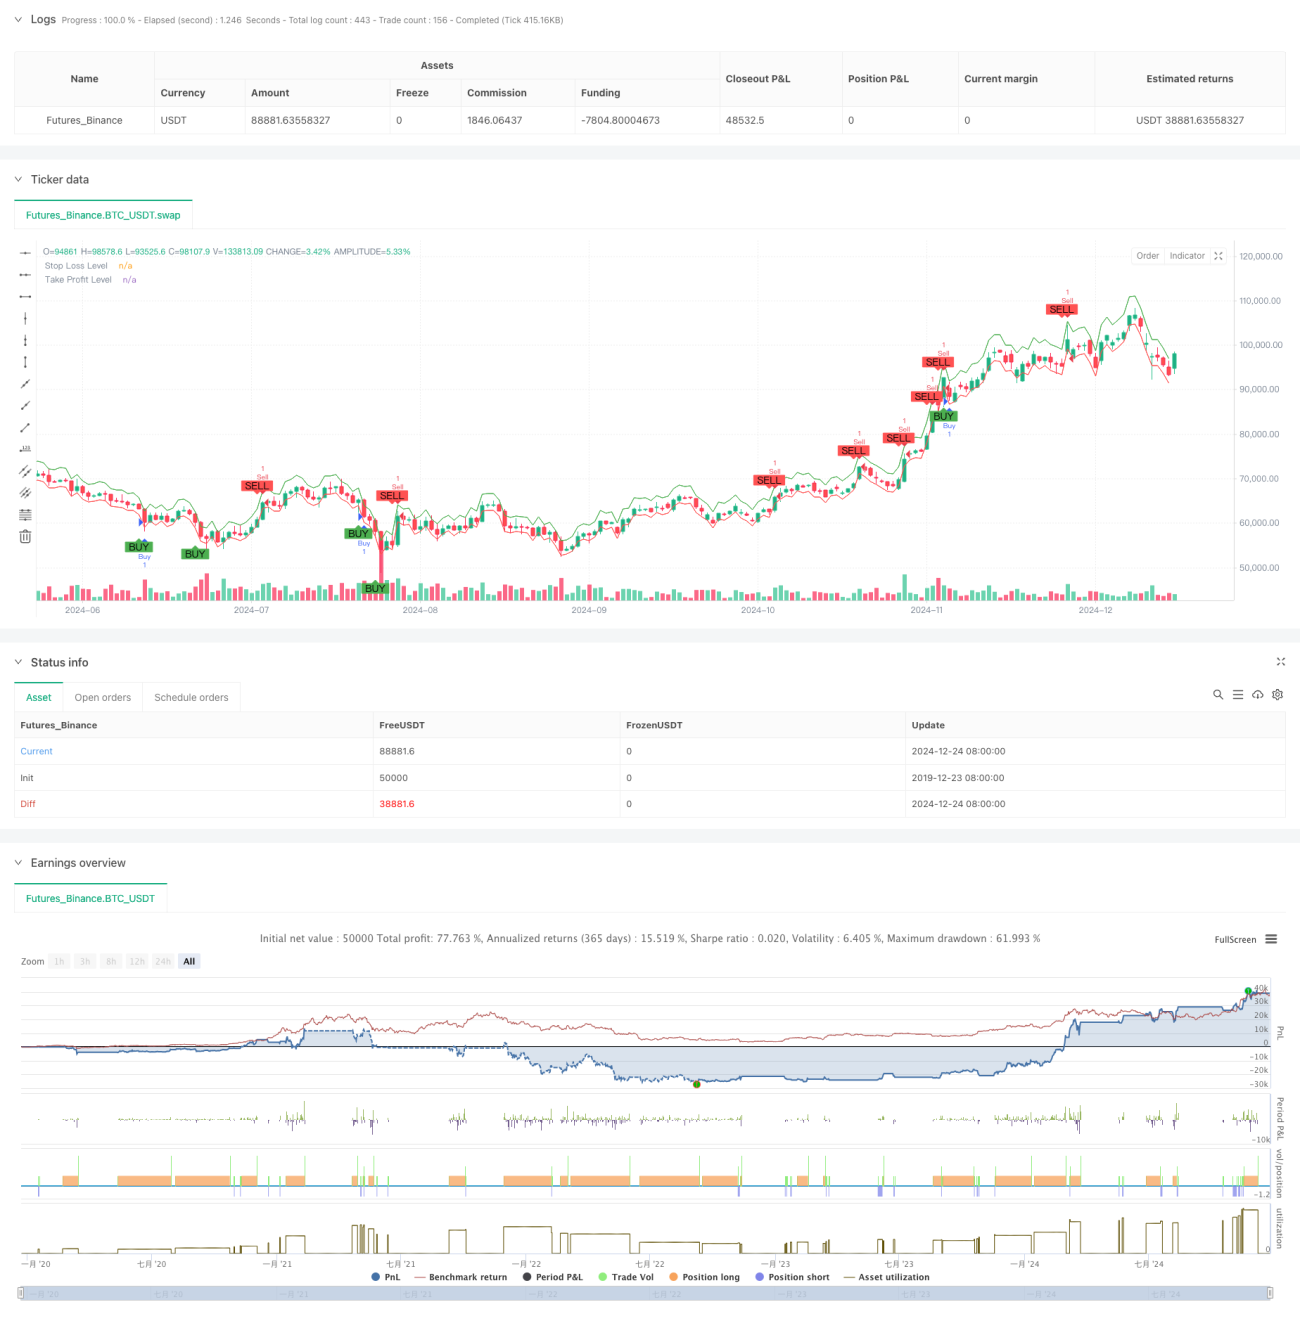
La estrategia es un sistema de negociación auto-adaptativo basado en el índice Shiryaev-Zhou (SZI). Identifica los estados de sobrecompra y sobreventa en el mercado mediante el cálculo de un puntaje estandarizado de la tasa de rendimiento aritmético, para capturar la oportunidad de un retorno promedio de los precios. La estrategia combina un objetivo de pérdida y ganancia dinámicos para un control preciso del riesgo.
Principio de estrategia
El núcleo de la estrategia es la construcción de indicadores estandarizados a través de las características estadísticas de rotación de la tasa de rendimiento de la armonía. Los pasos concretos son los siguientes:
- Cálculo de la rentabilidad de los pares para lograr el tratamiento de normalización de la rentabilidad
- Calculación de las medias y diferencias estándar con una ventana de 50 periodos
- Construir el indicador SZI: (Retorno de la rentabilidad aritmética - media rodante) / Diferencia estándar rodante
- Cuando el SZI está por debajo de -2,0 produce una señal múltiple, y por encima de -2,0 produce una señal vacía.
- Establecer un nivel de stop loss del 2% y un stop loss del 4% basado en el precio de entrada
Ventajas estratégicas
- Fundamento teórico sólido: basado en la hipótesis de la distribución logarítmica normal, con un buen apoyo estadístico
- Adaptabilidad: adaptación a los cambios en las características de la volatilidad del mercado mediante el cálculo de la ventana rodante
- Control de riesgo perfecto: la estrategia de stop loss porcentual permite un control preciso del riesgo de cada operación
- Visualización amigable: señala claramente las señales de negociación y los niveles de control de riesgo en el gráfico
Riesgo estratégico
- Sensibilidad de los parámetros: la elección de la longitud de la ventana de desplazamiento y el valor de umbral puede afectar significativamente el rendimiento de la estrategia
- Dependencia del entorno del mercado: señales falsas frecuentes que pueden producirse en mercados de tendencia
- Efectos de los puntos de deslizamiento: los precios reales de transacción pueden desviarse significativamente de los niveles ideales durante períodos de gran volatilidad
- Retardo en el cálculo: el cálculo de las estadísticas en tiempo real puede generar un cierto retraso en la señal
Dirección de optimización de la estrategia
- Término dinámico: se puede considerar el ajuste dinámico del nivel de señal en función de la volatilidad del mercado
- Múltiples períodos de tiempo: Mecanismos de confirmación de señales que introducen múltiples períodos de tiempo
- Filtrado de fluctuaciones: suspender la negociación o ajustar la posición durante la volatilidad extrema
- Confirmación de señales: incremento de tráfico, potencia y otros indicadores auxiliares para confirmar la señal
- Gestión de posiciones: implementación de gestión de posiciones dinámicas basadas en la volatilidad
Resumir
Se trata de una estrategia de comercio cuantitativa basada en una sólida estadística, que captura oportunidades de fluctuación de precios mediante la estandarización de los rendimientos lógicos. Las principales ventajas de la estrategia residen en su adaptabilidad y un buen control del riesgo, pero aún hay espacio para la optimización en la selección de parámetros y la adaptabilidad al entorno del mercado.
- 1