
Descripción general
La estrategia es un sistema comercial integral basado en el índice de fuerza relativa (RSI), la media móvil (MA) y el impulso de los precios. La estrategia identifica principalmente oportunidades comerciales potenciales mediante el monitoreo de los cambios de tendencia del RSI, los cruces de promedios móviles de múltiples períodos de tiempo y los cambios en el impulso de los precios. Esta estrategia presta especial atención a la tendencia ascendente del RSI y a la tendencia ascendente continua de los precios, y mejora la precisión de las transacciones a través de múltiples confirmaciones.
Principio de estrategia
La lógica central de la estrategia se basa en los siguientes componentes clave:
- Análisis de tendencia RSI: utilice el indicador RSI de 13 períodos y su promedio móvil para confirmar la fortaleza del precio
- Confirmación del impulso del precio: se requieren 3 máximos consecutivos más altos para confirmar la sostenibilidad de la tendencia alcista
- Sistema de medias móviles múltiples: uso de medias móviles de 21, 55 y 144 días como filtros de tendencia
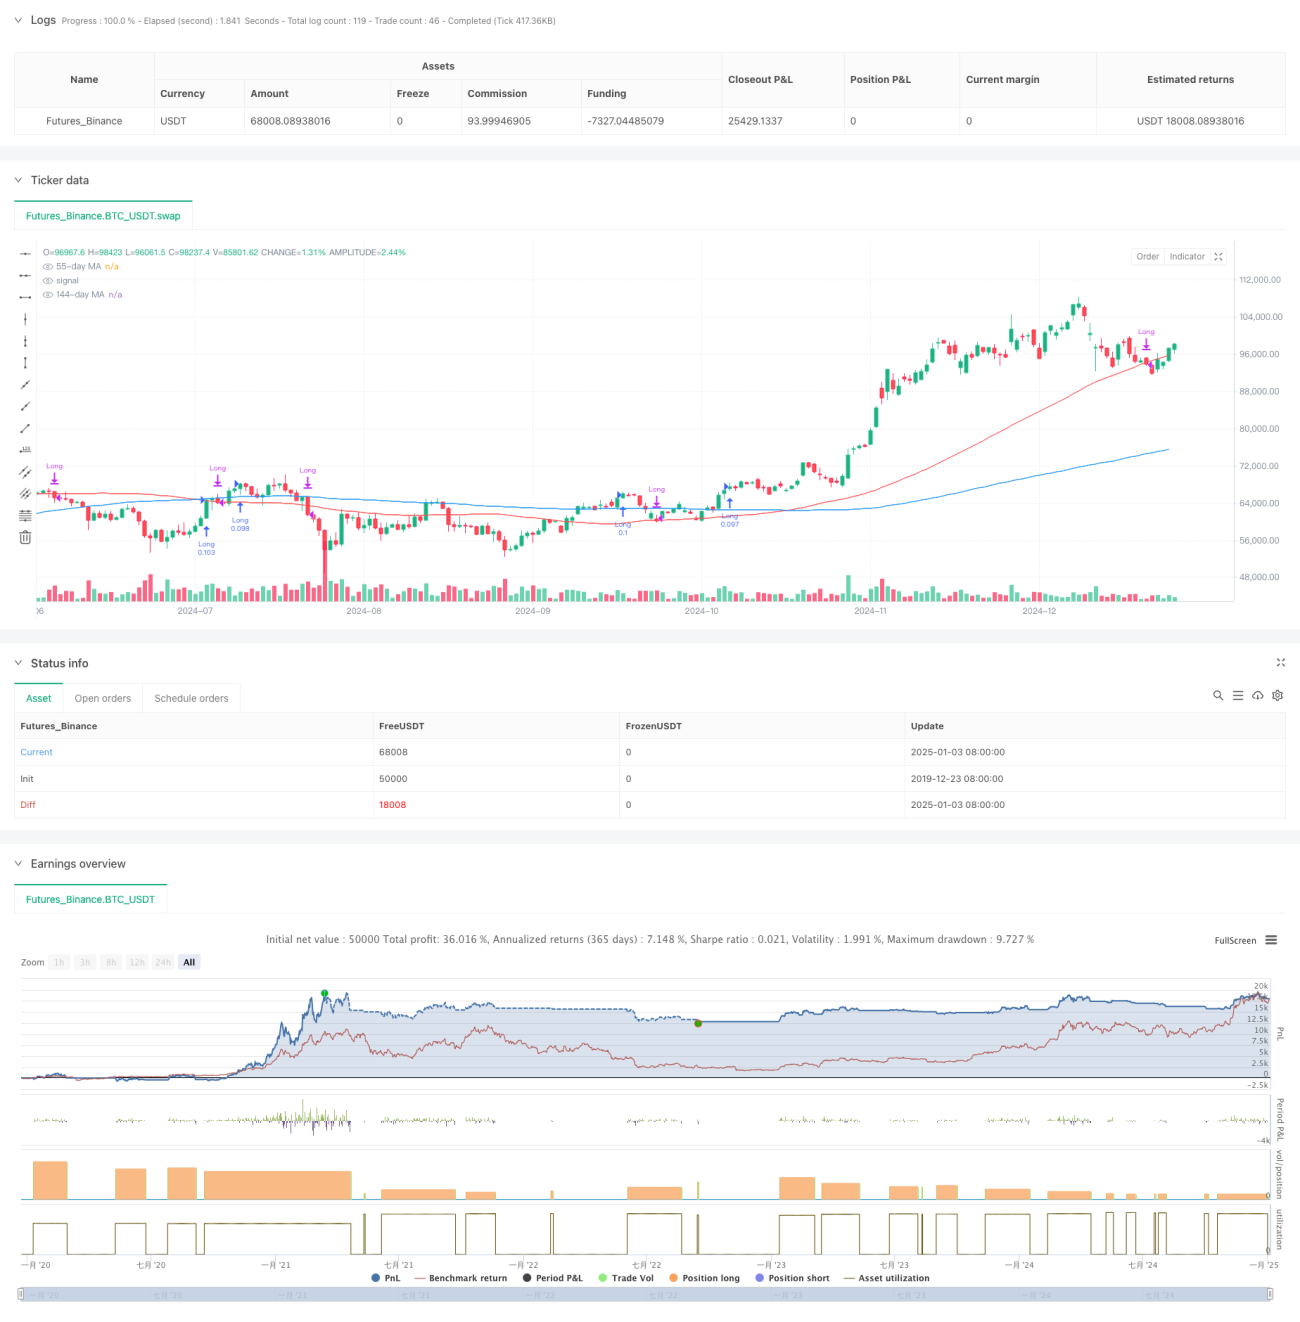
- Gestión de fondos: Utilice el 10% del capital de la cuenta para el control de posiciones en cada transacción
Se deben cumplir las condiciones de compra: el RSI es mayor que su promedio, el precio forma máximos consecutivos más altos, el RSI mantiene una tendencia alcista
Las condiciones de venta incluyen: el precio cae por debajo del promedio móvil de 55 días o el RSI cae por debajo del promedio y el precio cae por debajo del promedio móvil de 55 días.
Ventajas estratégicas
- Mecanismo de confirmación múltiple: mejora la confiabilidad de las señales comerciales a través de múltiples verificaciones de RSI, impulso de precios y sistema de promedio móvil.
- Capacidad de seguimiento de tendencias: la estrategia puede capturar eficazmente las tendencias a medio y largo plazo y evitar falsas rupturas.
- Control perfecto del riesgo: controle el riesgo mediante la gestión de posiciones y condiciones claras de stop loss
- Fuerte adaptabilidad: se puede aplicar a diferentes períodos de tiempo y entornos de mercado.
- Gestión razonable de los fondos: utilice el porcentaje de capital de la cuenta para controlar las posiciones y evitar los riesgos de las posiciones fijas
Riesgo estratégico
- Riesgo de rezago: los promedios móviles y los indicadores RSI tienen un cierto rezago, lo que puede provocar un ligero retraso en el momento de entrada y salida.
- Riesgo de mercado volátil: pueden producirse señales falsas frecuentes en un mercado lateral y volátil.
- Riesgo de pérdida continua: puede enfrentar pérdidas de stop continuas durante períodos de fluctuaciones del mercado.
Solución:
- Añadir filtro de entorno de mercado
- Optimización de los parámetros del indicador
- Introducción de un mecanismo adaptativo a la volatilidad
Dirección de optimización de la estrategia
- Optimización de parámetros indicadores:
- Considere utilizar ciclos RSI adaptativos
- Ajuste los parámetros de media móvil según los diferentes ciclos del mercado
- Aumentar la identificación del entorno del mercado:
- Presentación del indicador de volatilidad
- Agregar filtro de fuerza de tendencia
- Mejorar el control de riesgos:
- Implementación de un mecanismo dinámico de stop loss
- Aumentar la gestión de objetivos de beneficios
- Optimizar la gestión de posiciones:
- Ajustar el tamaño de la posición según la intensidad de la señal
- Implementar un mecanismo para construir y reducir posiciones en lotes
Resumir
Esta estrategia construye un sistema comercial relativamente completo mediante el uso exhaustivo de indicadores de análisis técnico y métodos de análisis de impulso. La ventaja de la estrategia radica en su mecanismo de confirmación múltiple y su perfecto control del riesgo, pero también hay que prestar atención a la adaptabilidad al entorno del mercado y a las cuestiones de optimización de parámetros. Con una optimización y mejora continuas, esta estrategia tiene el potencial de convertirse en un sistema comercial sólido.
- 1