Estrategia innovadora de estructura inteligente de TIC basada en la combinación de señales dinámicas de múltiples períodos de tiempo

RSI MACD EMA BOS FVG HTF LTF ICT
Fecha de creación: 2025-01-06 14:09:05 Última modificación: 2025-01-06 14:09:05
Copiar: 0 Número de Visitas: 456
1
Seguir
1617
Seguidores

Estrategia innovadora de estructura inteligente de TIC basada en la combinación de señales dinámicas de múltiples períodos de tiempo

Descripción general

La estrategia es un sistema de trading integral que combina múltiples indicadores técnicos y TIC (Concepto de Trading Institucional). Integra indicadores de análisis técnico tradicionales (RSI, indicadores estocásticos, MACD, EMA) y conceptos de negociación de TIC modernos (brecha de valor justo, ruptura estructural, análisis de sesgo de período de tiempo alto) en diferentes períodos de tiempo y filtra períodos de negociación estrictos. Logre un mercado preciso control de acceso.

Principio de estrategia

La estrategia opera sobre la base de la coordinación de cinco componentes fundamentales:

  1. Análisis de sesgo de período de tiempo alto: utilice el promedio móvil de 200 días para determinar la dirección de la tendencia del mercado de un período de tiempo más alto
  2. Filtro de horario de negociación: limita la negociación a una “zona de eliminación” específica (07:00-10:00)
  3. Identificación de la brecha de valor razonable (FVG): identificación de brechas estructurales en el mercado a través de tres patrones de línea K
  4. Determinación de ruptura de estructura (BOS): una ruptura basada en un nivel de precio clave confirma un cambio de dirección
  5. Confirmación del indicador de período de tiempo bajo: verificación múltiple mediante RSI, indicador estocástico, MACD y promedio móvil de 200 días

Ventajas estratégicas

  1. Integración de señales multidimensionales: mejore la confiabilidad de la señal combinando múltiples indicadores técnicos independientes y conceptos de TIC
  2. Coordinación del ciclo de tiempo: La coordinación de ciclos de tiempo altos y bajos mejora la estabilidad de la señal.
  3. Captura de oportunidades estructurales: centrarse en oportunidades comerciales estructurales de alta probabilidad a través de la identificación de FVG y BOS
  4. Control perfecto del riesgo: incluye mecanismos de stop loss y stop profit, gestión de fondos estandarizada
  5. Optimización del tiempo de negociación: reduzca las interferencias durante las horas no comerciales mediante el filtrado de tiempo

Riesgo estratégico

  1. Retraso de señal: la combinación de múltiples indicadores puede provocar un retraso en el momento de entrada.
  2. Rendimiento inestable del mercado: pueden producirse señales falsas frecuentes en un mercado lateral
  3. Sensibilidad de los parámetros: la configuración de múltiples parámetros indicadores requiere una verificación suficiente de los datos históricos.
  4. Riesgo de ejecución: una combinación compleja de condiciones puede provocar la pérdida de algunas oportunidades comerciales en operaciones reales.
  5. Dependencia del entorno del mercado: el rendimiento de las estrategias en diferentes entornos de mercado puede variar enormemente

Dirección de optimización de la estrategia

  1. Ajuste dinámico de parámetros: ajuste de forma adaptativa los parámetros de cada indicador según la volatilidad del mercado
  2. Clasificación del entorno de mercado: agregue un módulo de identificación del entorno de mercado y utilice diferentes combinaciones de parámetros para diferentes condiciones de mercado
  3. Optimización del peso de la señal: introducir métodos de aprendizaje automático para optimizar la distribución del peso de varios indicadores
  4. Expansión del período de tiempo: agregue más períodos de tiempo para el análisis y mejore la confiabilidad de la señal
  5. Mayor control de riesgos: introducción de un mecanismo dinámico de stop loss y optimización de las estrategias de gestión de fondos

Resumir

Esta estrategia construye un sistema comercial integral integrando el análisis técnico tradicional con conceptos modernos de TIC. Sus ventajas radican en la confirmación de señales multidimensionales y un estricto control de riesgos, pero también enfrenta desafíos en la optimización de parámetros y la adaptabilidad al mercado. A través de la optimización y mejora continuas, se espera que la estrategia mantenga un rendimiento estable en diferentes entornos de mercado.
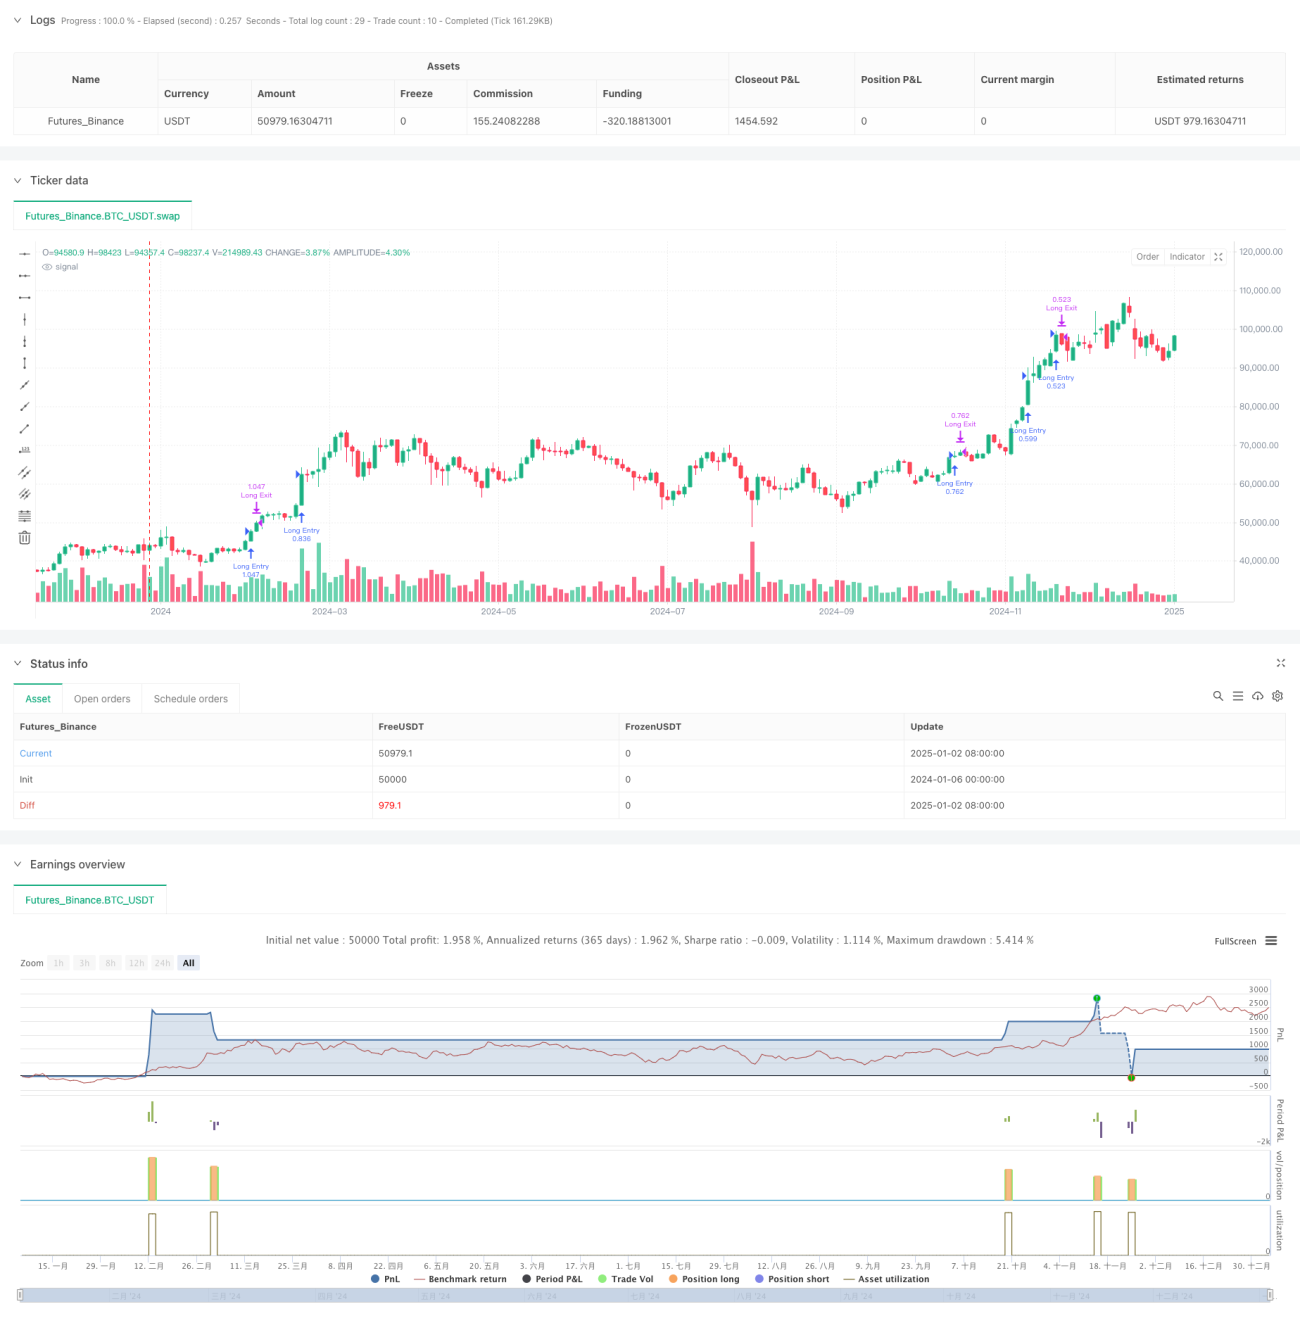
Código Fuente de la Estrategia
/*backtest
start: 2024-01-06 00:00:00
end: 2025-01-04 08:00:00
period: 2d
basePeriod: 2d
exchanges: [{"eid":"Futures_Binance","currency":"BTC_USDT"}]
*/

// -----------------------------------------------------
// Multi-Signal Conservative Strategy (Pine Script v5)
// + More ICT Concepts (HTF Bias, FVG, Killzone, BOS)
// -----------------------------------------------------
//
// Combines:
// - RSI, Stochastic, MACD, 200 EMA (lower TF)
// - Higher Timeframe (HTF) bias check via 200 EMA
// - Kill Zone time filter
// - Fair Value Gap (FVG) detection (simplified 3-candle approach)
// - Break of Structure (BOS) using pivot highs/lows
// - Only trade markers on chart (no extra indicator plots).
//
// Use on lower timeframes: 1m to 15m
// Always backtest thoroughly and manage risk properly.
//
// -----------------------------------------------------
//@version=5
strategy(title="Multi-Signal + ICT Concepts (HTF/FVG/Killzone/BOS)", shorttitle="ICTStrategyExample",overlay=true, pyramiding=0, initial_capital=10000, default_qty_type=strategy.percent_of_equity, default_qty_value=100)

// -----------------------------------------------------
// User Inputs
// -----------------------------------------------------
/////////////// Lower TF Inputs ///////////////
emaLength       = input.int(200,   "LTF EMA Length",           group="Lower TF")
rsiLength       = input.int(14,    "RSI Length",               group="Lower TF")
rsiUpper        = input.int(60,    "RSI Overbought Thresh",    group="Lower TF", minval=50, maxval=80)
rsiLower        = input.int(40,    "RSI Oversold Thresh",      group="Lower TF", minval=20, maxval=50)
stochLengthK    = input.int(14,    "Stoch K Length",           group="Lower TF")
stochLengthD    = input.int(3,     "Stoch D Smoothing",        group="Lower TF")
stochSmooth     = input.int(3,     "Stoch Smoothing",          group="Lower TF")
macdFast        = input.int(12,    "MACD Fast Length",         group="Lower TF")
macdSlow        = input.int(26,    "MACD Slow Length",         group="Lower TF")
macdSignal      = input.int(9,     "MACD Signal Length",       group="Lower TF")

/////////////// ICT Concepts Inputs ///////////////
htfTimeframe    = input.timeframe("60", "HTF for Bias (e.g. 60, 240)", group="ICT Concepts")
htfEmaLen       = input.int(200,  "HTF EMA Length",                   group="ICT Concepts")
sessionInput    = input("0700-1000:1234567", "Kill Zone Window", group="ICT Concepts")
fvgLookbackBars = input.int(2,    "FVG Lookback Bars (3-candle check)",  group="ICT Concepts", minval=1, maxval=10)

/////////////// Risk Management ///////////////
stopLossPerc    = input.float(0.5, "Stop-Loss %",  step=0.1, group="Risk")
takeProfitPerc  = input.float(1.0, "Take-Profit %", step=0.1, group="Risk")

// -----------------------------------------------------
// 1) Higher Timeframe Bias
// -----------------------------------------------------
//
// We'll request the HTF close, then compute the HTF EMA on that data
// to decide if it's bullish or bearish overall.

htfClose       = request.security(syminfo.tickerid, htfTimeframe, close)
htfEma         = request.security(syminfo.tickerid, htfTimeframe, ta.ema(close, htfEmaLen))
isBullHTF      = htfClose > htfEma
isBearHTF      = htfClose < htfEma

// -----------------------------------------------------
// 2) Kill Zone / Session Filter
// -----------------------------------------------------
//
// We'll only consider trades if the current bar is within
// the user-defined session time (e.g., 07:00 to 10:00 local or exchange time).

isInKillZone = time(timeframe.period, sessionInput) != 0

// -----------------------------------------------------
// 3) Fair Value Gap (FVG) Detection (Simplified)
//
// For a "Bullish FVG" among bars [2], [1], [0]:
//     high[2] < low[0] => there's a gap that bar [1] didn't fill
// For a "Bearish FVG":
//     low[2] > high[0] => there's a gap that bar [1] didn't fill
//
// Real ICT usage might check partial fill, candle bodies vs wicks, etc.
// This is just a minimal example for demonstration.

fvgBarsAgo = fvgLookbackBars // default = 2
bullFVG = high[fvgBarsAgo] < low  // e.g. high[2] < low[0]
bearFVG = low[fvgBarsAgo]  > high // e.g. low[2]  > high[0]

// -----------------------------------------------------
// 4) Break of Structure (BOS)
// -----------------------------------------------------
// Using pivot detection from previous example:

swingLen = 2  // pivot detection length (bars on each side)
// Identify a pivot high at bar [1]
swingHigh = high[1] > high[2] and high[1] > high[0]
// Identify a pivot low at bar [1]
swingLow  = low[1]  < low[2]  and low[1]  < low[0]

// Track the most recent pivot high & low
var float lastPivotHigh = na
var float lastPivotLow  = na

if swingHigh
    lastPivotHigh := high[1]

if swingLow
    lastPivotLow := low[1]

bosUp   = not na(lastPivotHigh) and (close > lastPivotHigh)
bosDown = not na(lastPivotLow)  and (close < lastPivotLow)

// -----------------------------------------------------
// 5) Lower TF Indicator Calculations
// -----------------------------------------------------
ema200      = ta.ema(close, emaLength)  // 200 EMA on LTF
rsiValue    = ta.rsi(close, rsiLength)
kValue      = ta.stoch(high, low, close, stochLengthK)
dValue      = ta.sma(kValue, stochLengthD)
stochSignal = ta.sma(dValue, stochSmooth)
[macdLine, signalLine, histLine] = ta.macd(close, macdFast, macdSlow, macdSignal)

// LTF trend filter
isBullTrend = close > ema200
isBearTrend = close < ema200

// -----------------------------------------------------
// Combine All Conditions
// -----------------------------------------------------
//
// We'll require that all filters line up for a long or short:
//  - HTF bias
//  - kill zone
//  - bullish/bearish FVG
//  - BOS up/down
//  - RSI, Stoch, MACD alignment
//  - Price above/below LTF 200 EMA

longCondition = isInKillZone                     // must be in session
 and isBullHTF                                   // HTF bias bullish
 and bullFVG                                     // bullish FVG
 and bosUp                                       // BOS up
 and (rsiValue > rsiUpper)                       // RSI > threshold
 and (kValue > dValue)                           // stoch K above D
 and (macdLine > signalLine)                     // MACD bullish
 and isBullTrend                                 // above LTF 200 EMA

shortCondition = isInKillZone                    // must be in session
 and isBearHTF                                   // HTF bias bearish
 and bearFVG                                     // bearish FVG
 and bosDown                                     // BOS down
 and (rsiValue < rsiLower)                       // RSI < threshold
 and (kValue < dValue)                           // stoch K below D
 and (macdLine < signalLine)                     // MACD bearish
 and isBearTrend                                 // below LTF 200 EMA

// -----------------------------------------------------
// Strategy Entries
// -----------------------------------------------------
if longCondition
    strategy.entry("Long Entry", strategy.long)

if shortCondition
    strategy.entry("Short Entry", strategy.short)

// -----------------------------------------------------
// Risk Management (Stop-Loss & Take-Profit)
// -----------------------------------------------------
if strategy.position_size > 0
    // Long position exit
    strategy.exit("Long Exit", stop  = strategy.position_avg_price * (1.0 - stopLossPerc/100.0), limit = strategy.position_avg_price * (1.0 + takeProfitPerc/100.0))

if strategy.position_size < 0
    // Short position exit
    strategy.exit("Short Exit",  stop  = strategy.position_avg_price * (1.0 + stopLossPerc/100.0), limit = strategy.position_avg_price * (1.0 - takeProfitPerc/100.0))

// -----------------------------------------------------
// Hide All Indicator Plots
// (We only show trade markers for entry & exit)
// -----------------------------------------------------
// Comment out or remove any plot() calls so chart stays clean.
//
// Example (commented out):
// plot(ema200, title="EMA 200", color=color.new(color.yellow, 0), linewidth=2)
// plot(rsiValue, title="RSI", color=color.new(color.blue, 0))
// plot(macdLine, title="MACD", color=color.new(color.teal, 0))
// plot(signalLine, title="Signal", color=color.new(color.purple, 0))