
Descripción general
Esta estrategia es un sistema de trading avanzado que combina el oscilador WaveTrend con bandas de media móvil EMA. Al integrar estos dos indicadores técnicos, se forma una estrategia comercial que puede capturar con precisión los puntos de inflexión en las tendencias del mercado. La estrategia adopta configuraciones dinámicas de stop-profit y stop-loss, buscando mayores retornos mientras se protege la seguridad del capital.
Principio de estrategia
El núcleo de la estrategia es identificar señales comerciales a través de la coordinación del indicador WaveTrend y los ocho promedios móviles EMA. El indicador WaveTrend mide el estado de sobrecompra o sobreventa del mercado calculando la desviación entre el precio y la media móvil. La banda de media móvil EMA confirma la dirección de la tendencia al cruzar medias móviles de diferentes períodos. Específicamente:
- Cuando EMA2 cruza EMA8, o aparece una señal de triángulo azul (EMA2 cruza EMA3) y no hay un patrón de diamante de sangre, se activa una señal larga.
- Cuando EMA8 cruza EMA2, o aparece un patrón de diamante sangriento, se activa una señal corta.
- La configuración del stop loss utiliza el punto extremo después de la señal inversa anterior, lo que puede controlar eficazmente el riesgo.
- El objetivo de beneficio se establece en 2-3 veces la distancia del stop loss, lo que refleja una buena relación riesgo-rendimiento.
Ventajas estratégicas
- El mecanismo de doble confirmación mejora la confiabilidad de las señales comerciales
- Los ajustes dinámicos de stop loss pueden adaptarse mejor a las fluctuaciones del mercado
- Con una clara definición de la relación riesgo-rendimiento
- El uso de bandas de media móvil EMA ayuda a determinar la tendencia general del mercado.
- El indicador WaveTrend puede identificar eficazmente condiciones de mercado de sobrecompra y sobreventa
- La lógica de la estrategia es clara, fácil de entender e implementar.
Riesgo estratégico
- En mercados volátiles pueden producirse señales falsas frecuentes
- El stop loss dinámico se puede activar fácilmente durante fluctuaciones volátiles
- Los indicadores que se basan en datos históricos pueden fallar cuando el mercado cambia drásticamente.
- El uso de múltiples indicadores técnicos puede generar señales retrasadas
Solución:
- Se pueden agregar filtros de volatilidad para reducir señales falsas en mercados volátiles.
- Considere utilizar una configuración de stop loss más flexible
- Añadir mecanismo de confirmación de la fuerza de la tendencia
Dirección de optimización de la estrategia
- Introducir indicadores de volatilidad del mercado (como ATR) para ajustar dinámicamente la distancia de stop loss
- Añadir mecanismo de confirmación de volumen para mejorar la confiabilidad de la señal
- Considere agregar un filtro de fuerza de tendencia para operar solo en mercados con tendencias fuertes
- Optimice los parámetros de WaveTrend para adaptarse mejor a diferentes entornos de mercado
- Estudiar la sinergia de señales en diferentes períodos de tiempo.
Resumir
Este es un sistema de trading completo que combina el seguimiento de tendencias y los osciladores del análisis técnico. Al utilizar las bandas de promedio móvil WaveTrend y EMA en combinación, no solo puede comprender la tendencia general, sino también ingresar al mercado a tiempo en el punto de inflexión de la tendencia. El mecanismo dinámico de gestión de stop-profit y stop-loss proporciona a la estrategia buenas capacidades de control de riesgos. El espacio de optimización de la estrategia radica principalmente en la mejora del filtrado de señales y la gestión de riesgos.
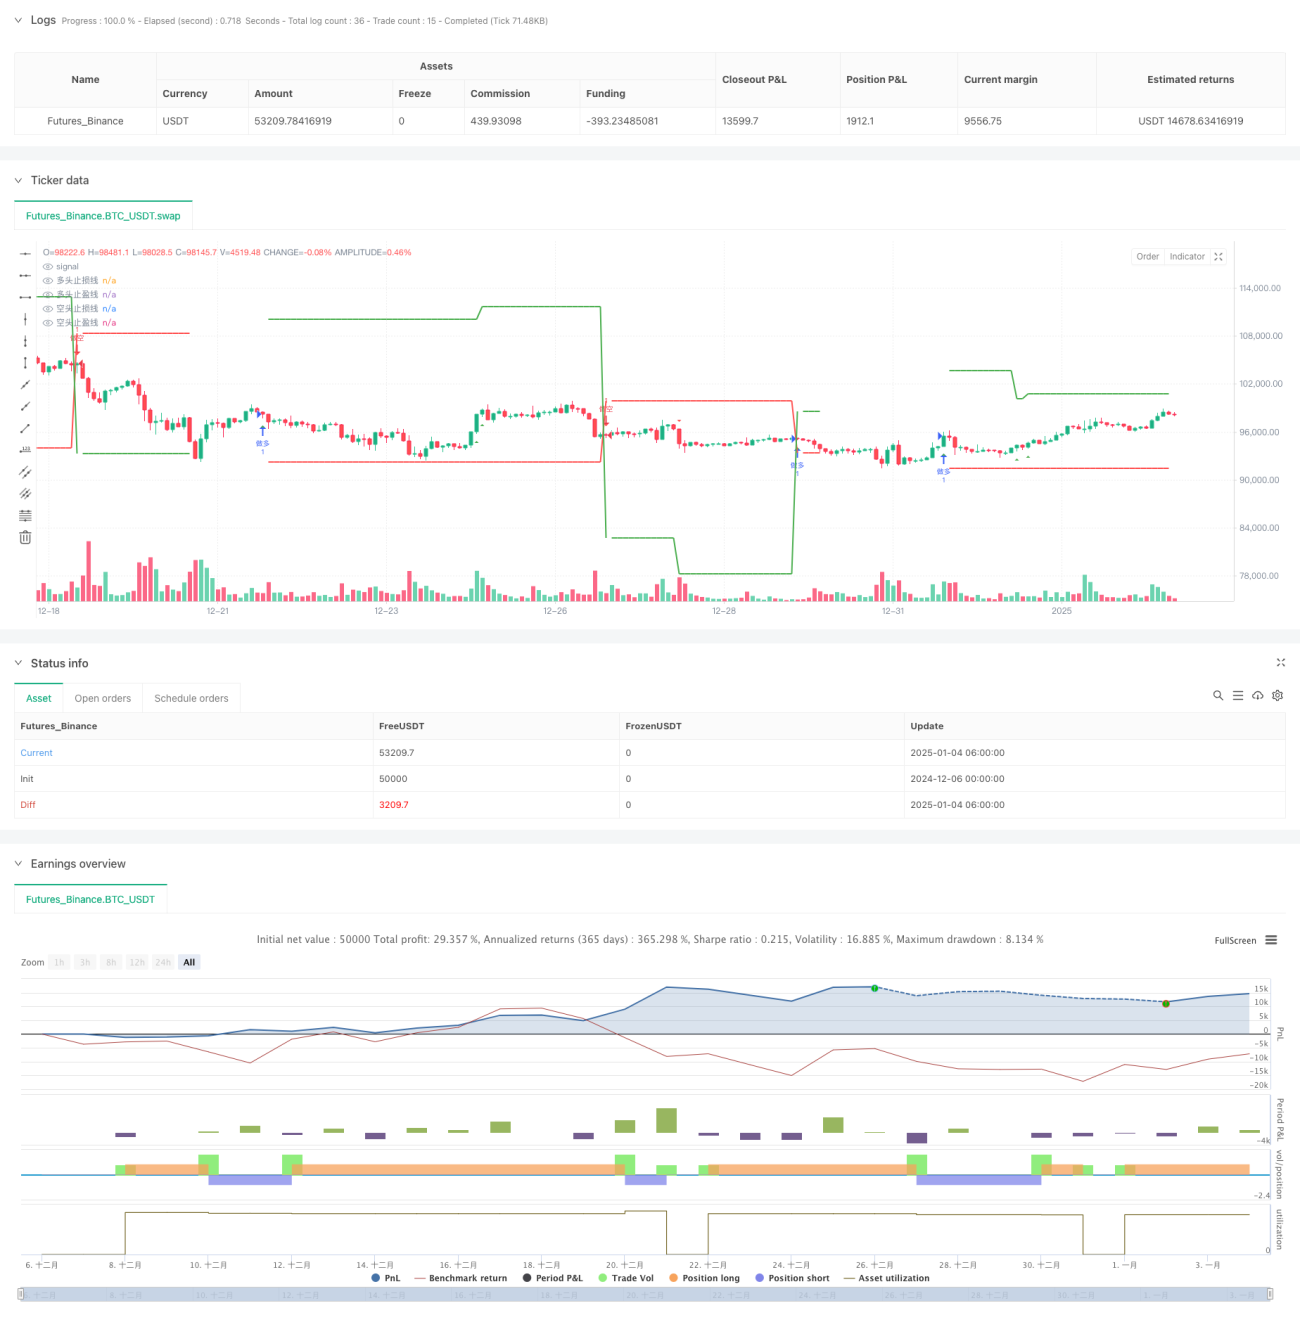
/*backtest
start: 2024-12-06 00:00:00
end: 2025-01-04 08:00:00
period: 2h
basePeriod: 2h
exchanges: [{"eid":"Futures_Binance","currency":"BTC_USDT"}]
*/

//@version=5
strategy("VuManChu Cipher A Strategy", overlay=true, initial_capital=10000, default_qty_type=strategy.fixed, default_qty_value=1.0)

// === 函数定义 ===- 1