
Descripción general
Esta estrategia es un sistema de trading cuantitativo basado en el cruce de medias móviles e indicadores RSI, utilizado principalmente para operar en el mercado de opciones. La estrategia utiliza las señales de cruce de los promedios móviles rápidos y lentos, combinadas con los niveles de sobrecompra y sobreventa del RSI para determinar el momento de las transacciones, al tiempo que se establecen take-profit y stop-loss para controlar los riesgos. Esta estrategia es adecuada para operar en un marco temporal de 5 minutos.
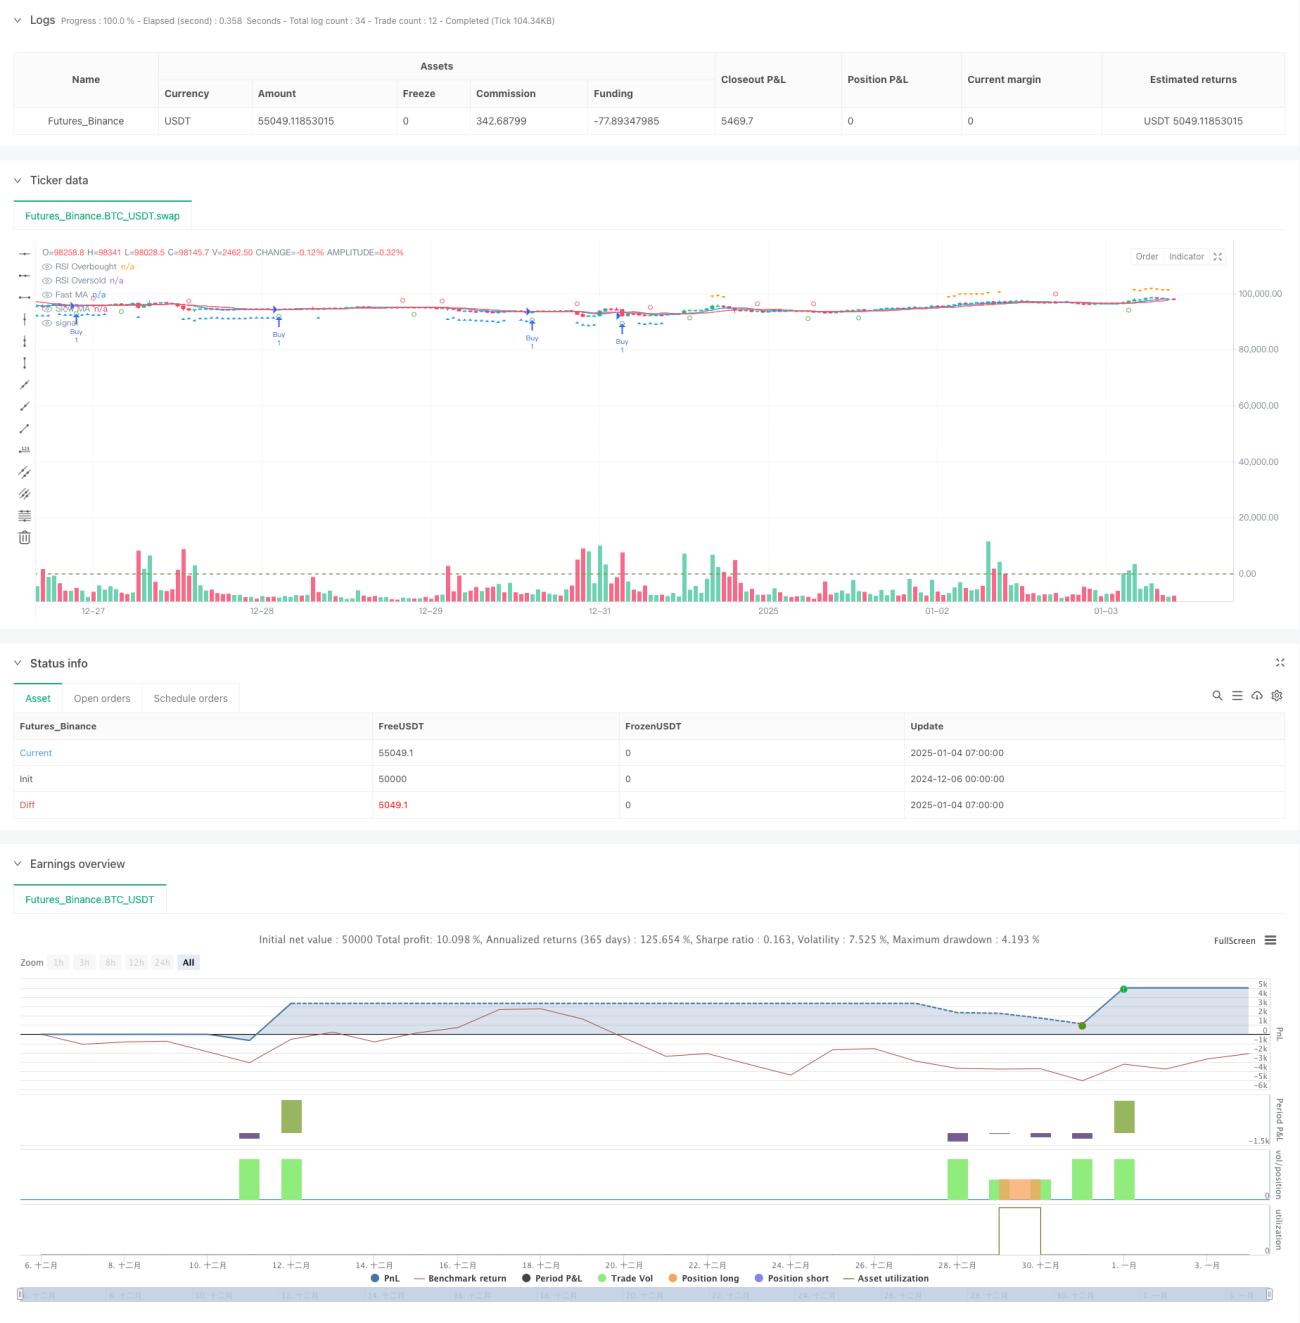
Principio de estrategia
La estrategia utiliza dos indicadores técnicos clave: media móvil (MA) e índice de fuerza relativa (RSI). Específicamente:
- Utilice promedios móviles simples (SMA) de 7 y 13 períodos para capturar tendencias de precios
- Uso del indicador RSI de 17 períodos para identificar condiciones de sobrecompra y sobreventa
- Cuando la media móvil rápida cruza la media móvil lenta hacia arriba y el RSI está por debajo de 43, el sistema genera una señal larga.
- Cuando la media móvil rápida cruza la media móvil lenta hacia abajo y el RSI está por encima de 64, el sistema genera una señal corta.
- Establezca un take profit del 4% y un stop loss del 0,5% para gestionar el riesgo
Ventajas estratégicas
- Mecanismo de confirmación múltiple: combina el cruce de medias móviles y los indicadores RSI para proporcionar señales comerciales más confiables
- Gestión perfecta de riesgos: establezca un porcentaje fijo de stop-profit y stop-loss para controlar los riesgos de forma eficaz
- Fuerte adaptabilidad: los parámetros se pueden ajustar de forma flexible según las diferentes condiciones del mercado.
- Soporte de visualización: La estrategia proporciona instrucciones gráficas claras para facilitar que los operadores comprendan las condiciones del mercado.
- Reglas de funcionamiento claras: condiciones de entrada y salida claras, reduciendo la interferencia causada por el juicio subjetivo
Riesgo estratégico
- Riesgo de mercado volátil: pueden producirse señales falsas frecuentes en un mercado lateral y volátil.
- Riesgo de deslizamiento: cuando el mercado de opciones no es líquido, puede enfrentar un gran deslizamiento.
- Sensibilidad de los parámetros: el efecto de la estrategia es sensible a la configuración de los parámetros y debe optimizarse continuamente.
- Dependencia del entorno del mercado: en un entorno de mercado volátil, el stop loss puede no ser lo suficientemente oportuno
- Riesgo sistémico: cuando se producen brechas en el mercado o eventos importantes, el stop loss puede fallar.
Dirección de optimización de la estrategia
- Introducción de indicadores de volatilidad: considere incorporar ATR o bandas de Bollinger en su sistema de toma de decisiones
- Optimizar la adaptación de parámetros: desarrollar un mecanismo de ajuste dinámico de parámetros basado en las condiciones del mercado
- Aumente el filtrado del sentimiento del mercado: combine el volumen de operaciones y otros indicadores para filtrar señales falsas
- Mejorar el mecanismo de stop loss: considerar la introducción de un stop loss dinámico para mejorar la eficiencia de la gestión de riesgos
- Agregar filtro de tiempo: agregue un límite de ventana de tiempo de negociación para evitar operaciones ineficientes
Resumir
Esta estrategia construye un sistema de trading relativamente completo combinando el cruce de medias móviles y los indicadores RSI. Las ventajas de la estrategia radican en la confirmación de múltiples señales y la gestión perfecta del riesgo, pero también es necesario prestar atención al impacto del entorno del mercado en el rendimiento de la estrategia. Se espera que mediante la optimización y mejora continuas, esta estrategia logre un rendimiento estable en el mercado de opciones. Se recomienda que los operadores realicen pruebas retrospectivas suficientes y optimicen los parámetros antes del uso en tiempo real.
- 1