
Descripción general
La estrategia es un sistema de trading de seguimiento de tendencias que combina señales de cruce de medias móviles con gestión dinámica de riesgos. Utiliza promedios móviles exponenciales rápidos y lentos (EMA) para identificar tendencias del mercado y los combina con el indicador Average True Range (ATR) para optimizar el momento de entrada. Al mismo tiempo, la estrategia integra mecanismos de triple protección: stop loss porcentual, target profit y trailing stop loss.
Principio de estrategia
La lógica central de la estrategia se basa en los siguientes elementos clave:
- Utilice los cruces EMA de 5 y 20 períodos para determinar la dirección de la tendencia
- Mejore la confiabilidad de las señales comerciales mediante el filtrado con múltiplos ATR
- Activar señales comerciales cuando se produce un cruce de EMA y el precio sale del canal ATR
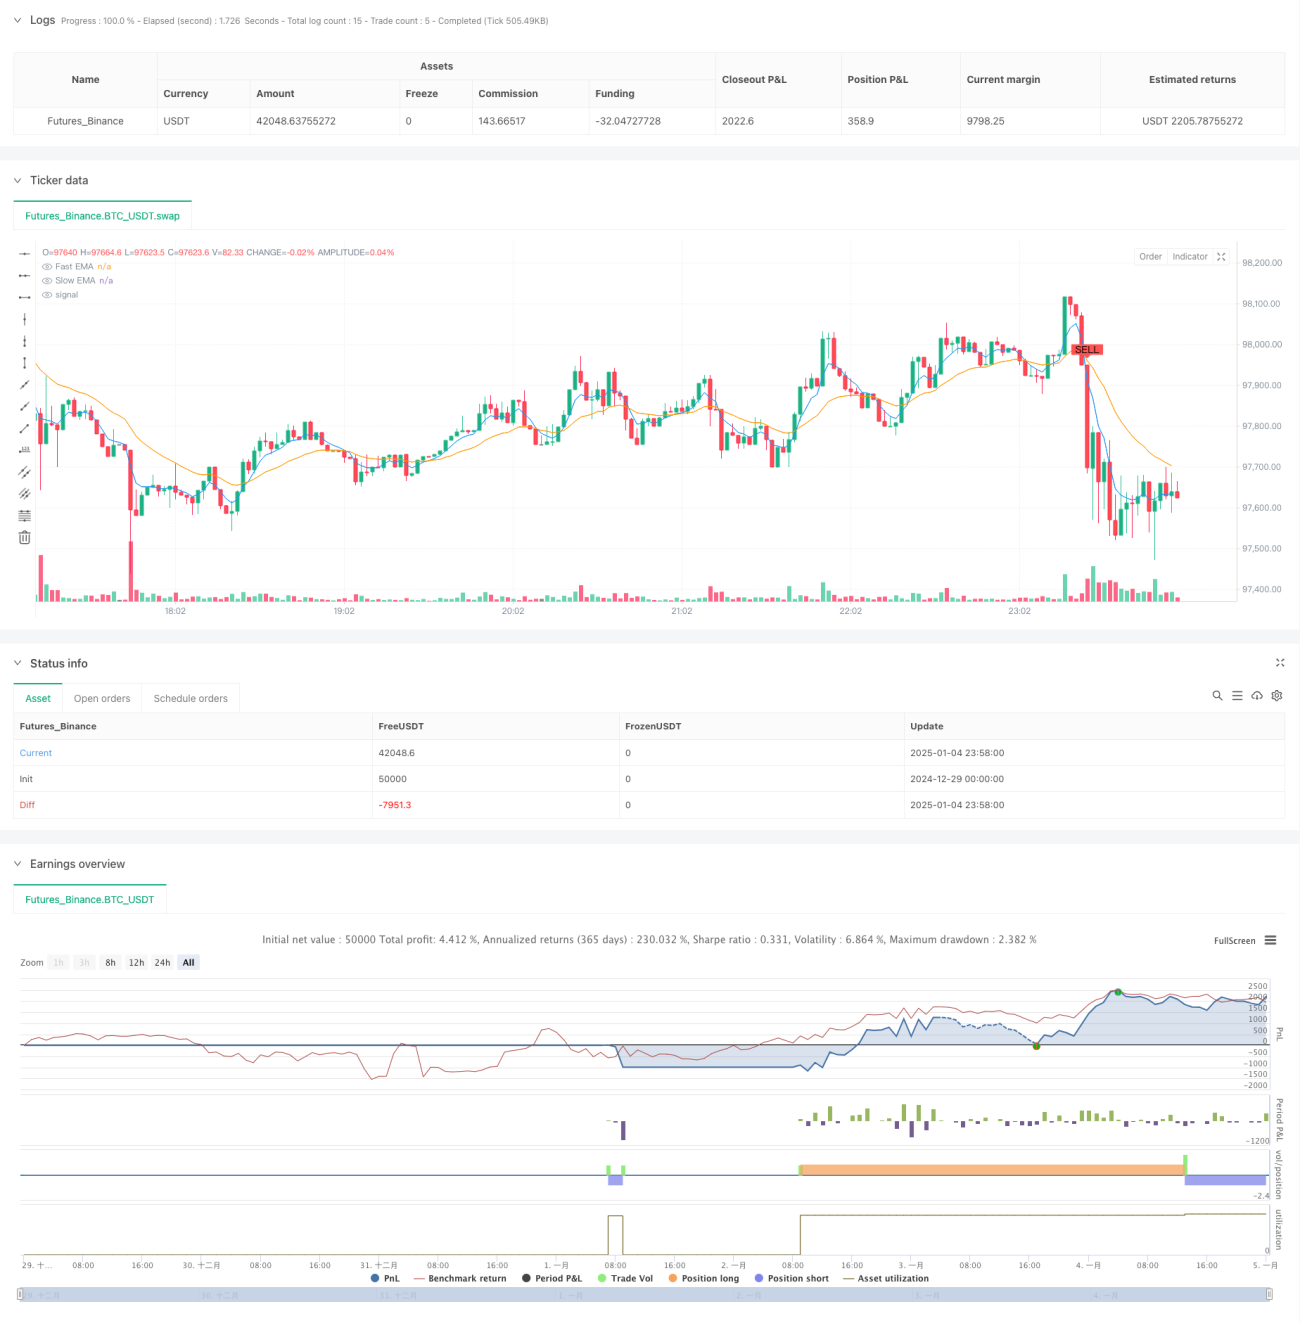
- Inmediatamente después de abrir una posición, establezca un stop loss fijo del 1% y un objetivo de ganancias del 5%.
- Utilice trailing stops basados en ATR para proteger las ganancias
- Transacciones bidireccionales largas y cortas, aproveche al máximo las oportunidades del mercado
Ventajas estratégicas
- El sistema de señales combina indicadores de tendencia y volatilidad para mejorar la precisión de las operaciones.
- Los canales ATR dinámicos pueden adaptarse a las características de volatilidad de diferentes entornos de mercado
- El mecanismo de control de triple riesgo proporciona protección integral para las transacciones.
- Los parámetros son altamente ajustables, lo que facilita la optimización según las diferentes características del mercado.
- El sistema tiene un alto grado de automatización, reduciendo el impacto emocional de la intervención humana.
Riesgo estratégico
- Los cruces de EMA pueden quedar rezagados y pueden provocar que se pierdan puntos de entrada en mercados volátiles
- Los stops de porcentaje fijo pueden no ser lo suficientemente flexibles durante períodos de alta volatilidad
- Las transacciones frecuentes pueden resultar en tarifas de transacción más altas
- Pueden ocurrir señales falsas frecuentes en mercados con límites de rango
- Los trailing stops pueden llevar a salidas anticipadas en retrocesos rápidos
Dirección de optimización de la estrategia
- Introducción de indicadores de volumen para verificar la validez de las tendencias
- Añadir un mecanismo de identificación del entorno del mercado y utilizar diferentes parámetros en diferentes condiciones del mercado
- Optimizar los múltiplos ATR y establecer un sistema de parámetros dinámicos adaptativos
- Combine más indicadores técnicos para filtrar señales falsas
- Desarrollar soluciones de gestión de fondos más flexibles
Resumir
Se trata de una estrategia de seguimiento de tendencias bien diseñada y lógicamente clara. Al capturar tendencias a través del cruce de promedios móviles, usar ATR para controlar riesgos y coordinar con múltiples mecanismos de stop-loss, se forma un sistema de trading completo. Las principales ventajas de la estrategia son su control integral del riesgo y su alta capacidad de personalización, pero en el trading real es necesario prestar atención a los problemas de señales falsas y costos de transacción. A través de las direcciones de optimización sugeridas, todavía hay margen para mejorar aún más la estrategia.
/*backtest
start: 2024-12-29 00:00:00
end: 2025-01-05 00:00:00
period: 2m
basePeriod: 2m
exchanges: [{"eid":"Futures_Binance","currency":"BTC_USDT"}]
*/

// This Pine Script™ code is subject to the terms of the Mozilla Public License 2.0 at https://mozilla.org/MPL/2.0/
// © jesusperezguitarra89

//@version=6- 1