
Descripción general
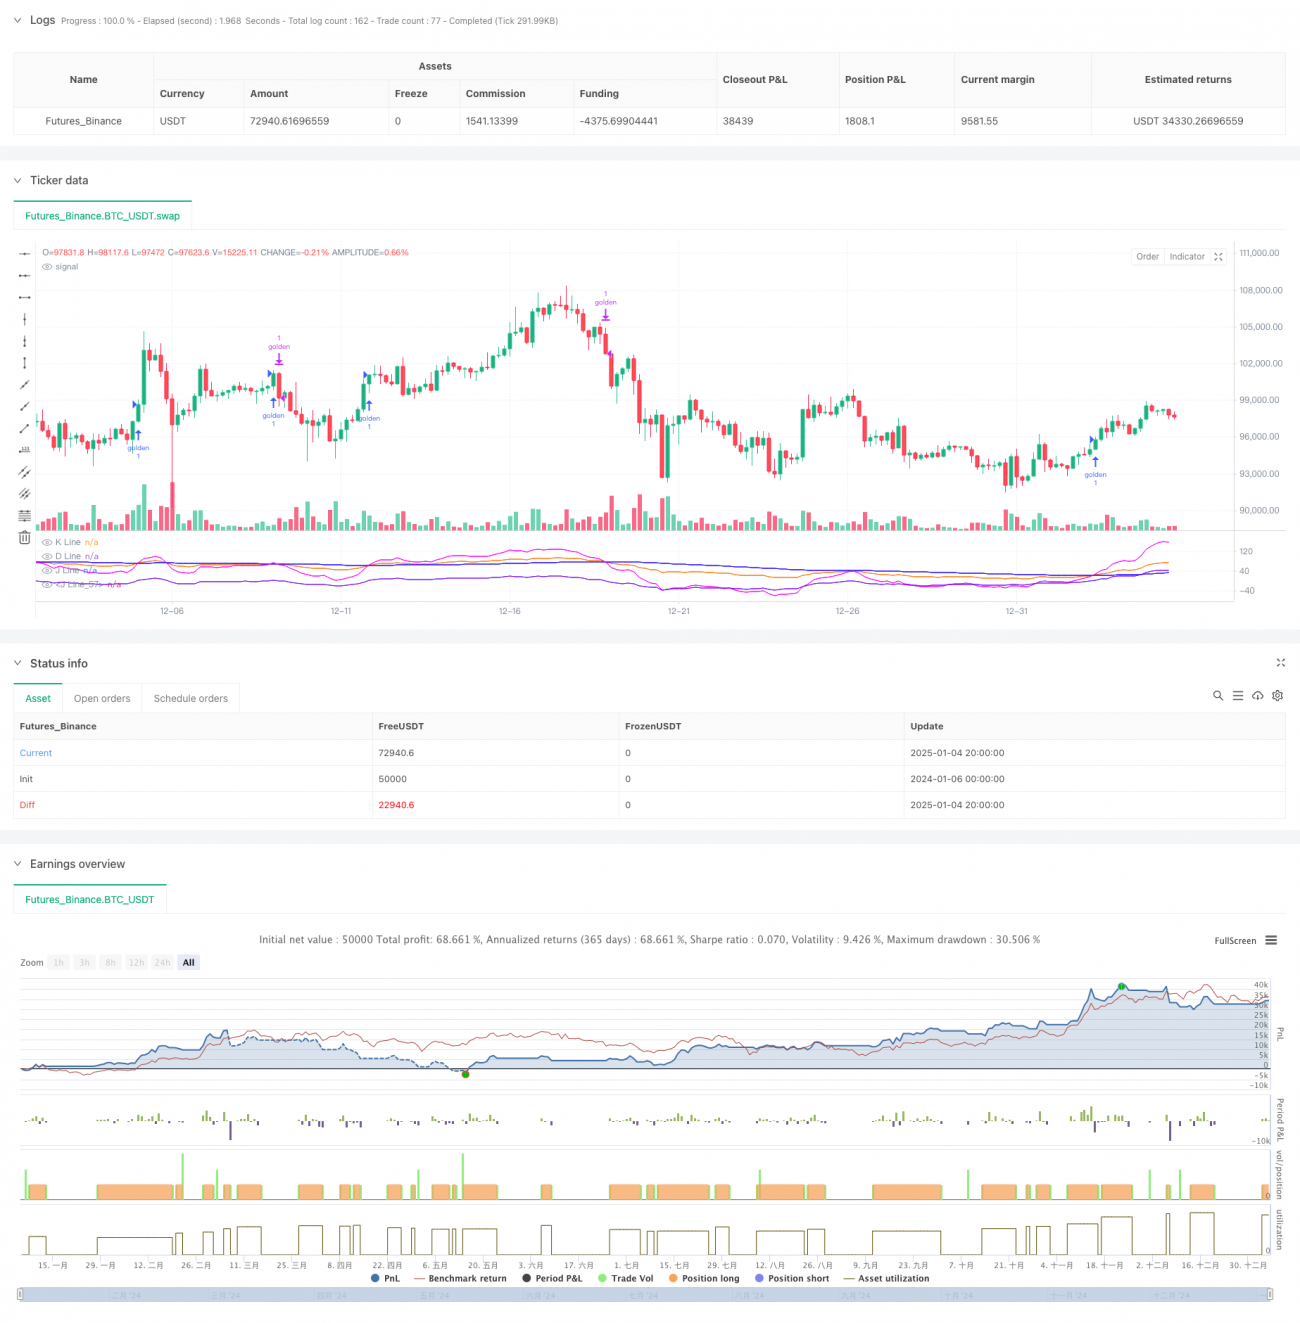
Esta estrategia es un sistema de trading avanzado basado en el indicador KDJ, que captura las tendencias del mercado realizando un análisis profundo de los patrones de cruce de las líneas K, D y J. La estrategia integra un algoritmo de suavizado BCWSMA personalizado y mejora la confiabilidad de las señales al optimizar el cálculo de indicadores estocásticos. El sistema adopta estrictos mecanismos de control de riesgos, incluidas funciones de stop loss y trailing stop loss, para lograr una gestión sólida de los fondos.
Principio de estrategia
La lógica central de la estrategia se basa en los siguientes elementos clave:
- El indicador KDJ se calcula utilizando un algoritmo BCWSMA (promedio móvil ponderado) personalizado, que mejora la suavidad y la estabilidad del indicador.
- Al calcular RSV (valor aleatorio inmaduro), el precio se convierte en un valor en el rango de 0 a 100 para reflejar mejor la posición del precio entre los puntos altos y bajos.
- Se diseñó un mecanismo único de validación cruzada de línea J y línea J5 (indicador derivado) para mejorar la precisión de las señales comerciales a través de múltiples confirmaciones.
- Se ha establecido un mecanismo de confirmación de tendencia basado en la continuidad, que requiere que la línea J permanezca por encima de la línea D durante tres días consecutivos para confirmar la validez de la tendencia.
- Un sistema de control de riesgo compuesto que integra stop loss porcentual y trailing stop loss
Ventajas estratégicas
- Mecanismo avanzado de generación de señales: a través de la validación cruzada de múltiples indicadores técnicos, el impacto de las señales falsas se reduce significativamente.
- Control de riesgo perfecto: adopte un mecanismo de control de riesgo de múltiples niveles, que incluye stop loss fijo y stop loss móvil, para controlar eficazmente el riesgo a la baja.
- Fuerte capacidad de ajuste de parámetros: los parámetros clave como el ciclo KDJ, el coeficiente de suavizado de señal, etc. se pueden ajustar de manera flexible según las condiciones del mercado.
- Alta eficiencia computacional: el uso del algoritmo BCWSMA optimizado reduce la complejidad computacional y mejora la eficiencia de ejecución de la estrategia
- Buena adaptabilidad: puede adaptarse a diferentes entornos de mercado y optimizar el rendimiento de la estrategia mediante el ajuste de parámetros.
Riesgo estratégico
- Riesgo de mercado volátil: pueden producirse frecuentes señales de ruptura falsas en un mercado volátil lateral, lo que aumenta los costos de transacción.
- Riesgo de retraso: debido al uso de suavizado de promedio móvil, la señal puede retrasarse hasta cierto punto.
- Sensibilidad de los parámetros: el efecto de la estrategia es sensible a la configuración de los parámetros. Una configuración incorrecta de los parámetros puede reducir significativamente el efecto de la estrategia.
- Dependencia del entorno de mercado: En ciertos entornos de mercado, el rendimiento de la estrategia puede no ser ideal.
Dirección de optimización de la estrategia
- Optimización del mecanismo de filtrado de señales: se pueden introducir indicadores auxiliares como el volumen de operaciones y la volatilidad para mejorar la confiabilidad de las señales.
- Ajuste dinámico de parámetros: ajuste dinámicamente los parámetros de KDJ y los parámetros de stop loss según las fluctuaciones del mercado
- Identificación del entorno de mercado: agregue un módulo de evaluación del entorno de mercado para adoptar diferentes estrategias comerciales en diferentes entornos de mercado
- Control de riesgo mejorado: se pueden agregar medidas de control de riesgo adicionales, como control de reducción máxima y límite de tiempo de mantenimiento de posición.
- Optimización del rendimiento: optimice aún más el algoritmo BCWSMA para mejorar la eficiencia del cálculo
Resumir
Esta estrategia construye un sistema de trading completo a través de una combinación innovadora de indicadores técnicos y un estricto control de riesgos. Las principales ventajas de la estrategia residen en su mecanismo de confirmación de señales múltiples y su perfecto sistema de control de riesgos, pero también se debe prestar atención a cuestiones como la optimización de parámetros y la adaptabilidad al entorno del mercado. A través de la optimización y mejora continuas, se espera que la estrategia mantenga un rendimiento estable en diferentes entornos de mercado.
- 1