Estrategia de trading cuantitativo de series temporales múltiples basada en RSI suavizado EMA y stop-profit y stop-loss dinámicos ATR

Descripción general
Esta estrategia es un sistema de trading cuantitativo integral basado en el índice de fuerza relativa (RSI), la media móvil exponencial (EMA) y el rango verdadero promedio (ATR). La estrategia utiliza EMA para suavizar el RSI, activa transacciones a través de señales de ruptura del RSI en niveles clave y utiliza ATR para establecer dinámicamente niveles de stop-loss y take-profit para lograr un control de riesgo efectivo. Al mismo tiempo, la estrategia también incluye la función de contar y registrar señales comerciales, lo que ayuda a los operadores a realizar pruebas retrospectivas y optimizar las estrategias.
Principio de estrategia
La lógica central de la estrategia incluye las siguientes partes clave:
- Calcule las condiciones de mercado de sobrecompra y sobreventa utilizando el RSI de 14 períodos
- Suavizar el RSI con EMA reduce las señales falsas
- Generar señales comerciales cuando el RSI atraviese los dos niveles clave de 70 y 30
- Utilice ATR para calcular dinámicamente posiciones de stop loss y take profit para mejorar la flexibilidad de la gestión de riesgos
- Cree una tabla de conteo de señales comerciales para registrar la información de precios de cada transacción
Ventajas estratégicas
- Fuerte suavidad de señal: RSI se suaviza mediante EMA, lo que reduce eficazmente la interferencia de señales de ruptura falsas.
- Control de riesgo perfecto: adopte la solución de stop loss dinámico ATR, que puede ajustar la posición de stop loss según las fluctuaciones del mercado.
- Mecanismo de negociación bidireccional: admite operaciones bidireccionales largas y cortas para aprovechar al máximo las oportunidades del mercado
- Ajustabilidad de parámetros: los parámetros clave se pueden personalizar para facilitar la optimización según las diferentes características del mercado.
- Monitoreo visual: registre las señales comerciales en tablas para facilitar el monitoreo de la estrategia y el análisis de backtesting
Riesgo estratégico
- Riesgo de ruptura falsa del RSI: incluso después de suavizar la EMA, el RSI aún puede generar señales de ruptura falsas
- Stop loss ATR insuficiente: cuando el mercado fluctúa violentamente, una configuración incorrecta del múltiplo ATR puede provocar que el stop loss sea demasiado flojo o demasiado ajustado.
- Riesgo de optimización de parámetros: la optimización excesiva de los parámetros puede provocar un sobreajuste de la estrategia
- Dependencia del entorno del mercado: el rendimiento puede diferir significativamente en mercados con tendencias y volátiles
Dirección de optimización de la estrategia
- Introducción al análisis de múltiples períodos de tiempo: combinación de señales RSI de largo plazo para la confirmación de transacciones
- Optimice el mecanismo de stop loss: considere ajustar dinámicamente el múltiplo ATR en combinación con los niveles de soporte y resistencia
- Aumente el criterio del entorno del mercado: agregue indicadores de criterio de tendencias y ajuste los parámetros de estrategia en diferentes entornos del mercado
- Mejore el filtrado de señales: considere agregar indicadores auxiliares, como el volumen de operaciones, para filtrar señales de ruptura falsas.
- Presentamos la gestión de posiciones: ajuste dinámicamente el tamaño de las posiciones en función de la intensidad de la señal y la volatilidad del mercado
Resumir
Esta estrategia construye un sistema de trading cuantitativo completo combinando tres indicadores técnicos clásicos: RSI, EMA y ATR. La estrategia es muy práctica en términos de generación de señales, control de riesgos y ejecución de transacciones. Se espera que mediante la optimización y mejora continuas, la estrategia logre un rendimiento estable en el comercio real. Sin embargo, los usuarios deben prestar atención al impacto del entorno del mercado en el rendimiento de la estrategia, establecer parámetros razonablemente y hacer un buen trabajo de control de riesgos.
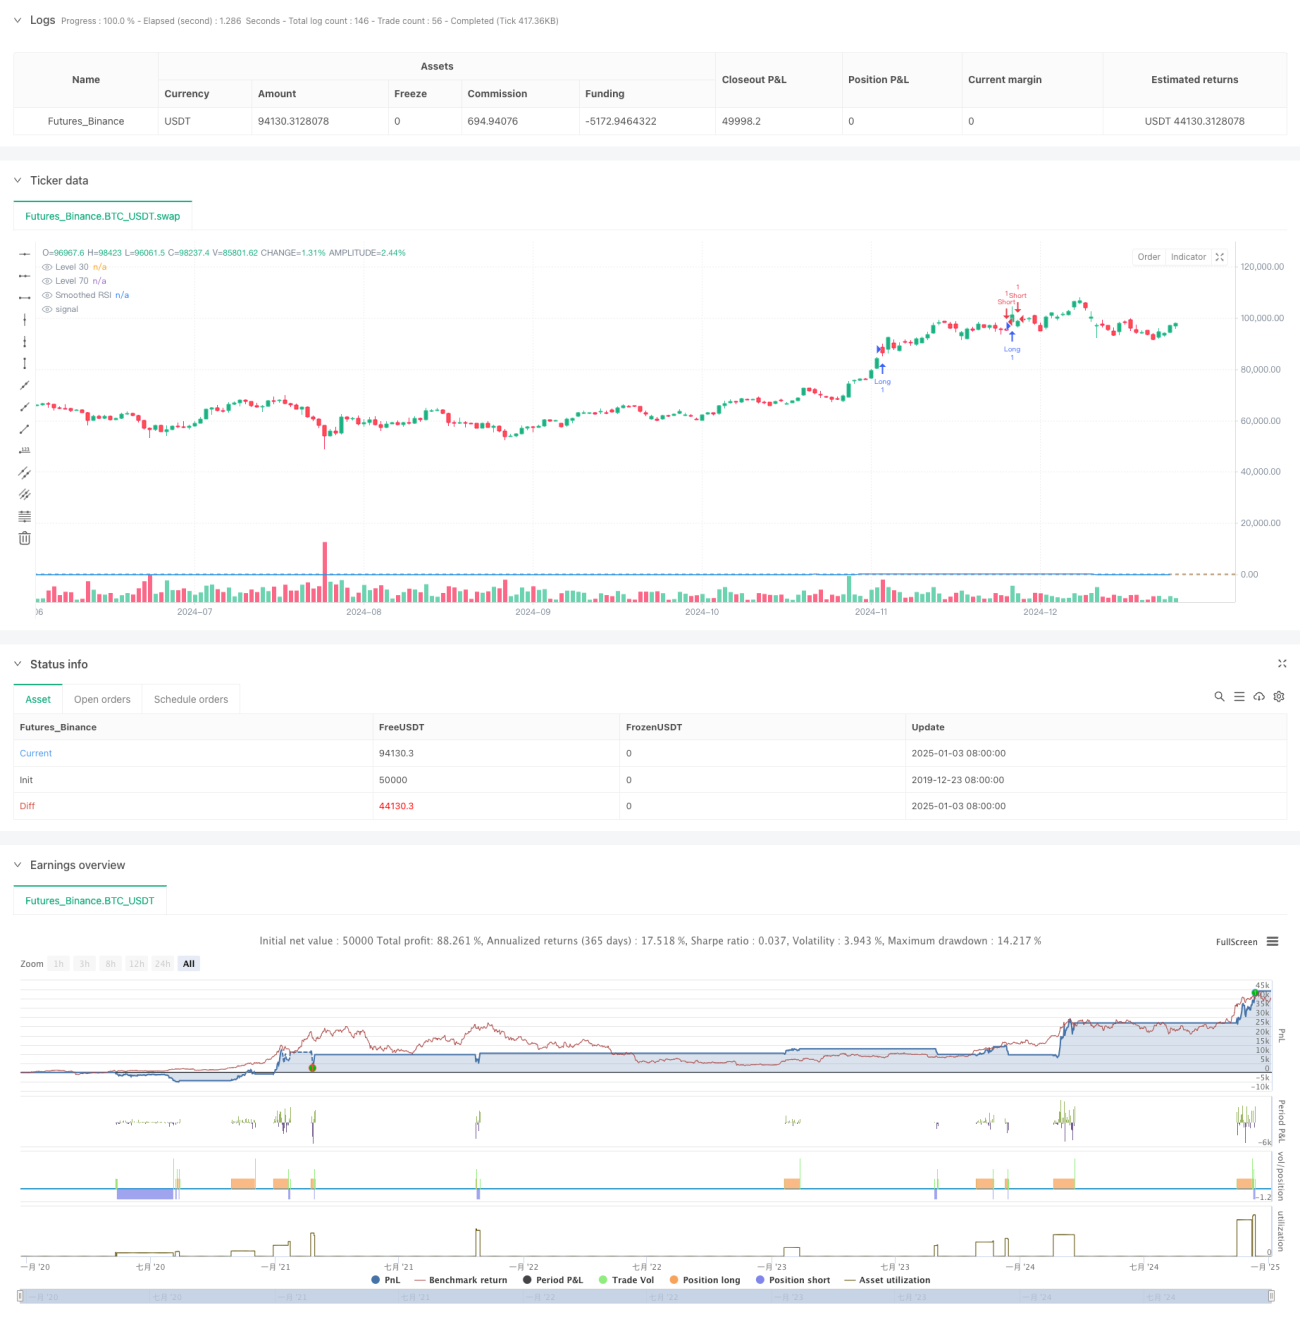
/*backtest
start: 2019-12-23 08:00:00
end: 2025-01-04 08:00:00
period: 1d
basePeriod: 1d
exchanges: [{"eid":"Futures_Binance","currency":"BTC_USDT"}]
*/

//@version=6
strategy("RSI Trading Strategy with EMA and ATR Stop Loss/Take Profit", overlay=true)
length = input.int(14, minval=1, title="RSI Length")
src = input(close, title="Source")- 1