Estrategia de trading con inversión de impulso con indicador técnico dual combinada con un sistema de gestión de riesgos

Descripción general
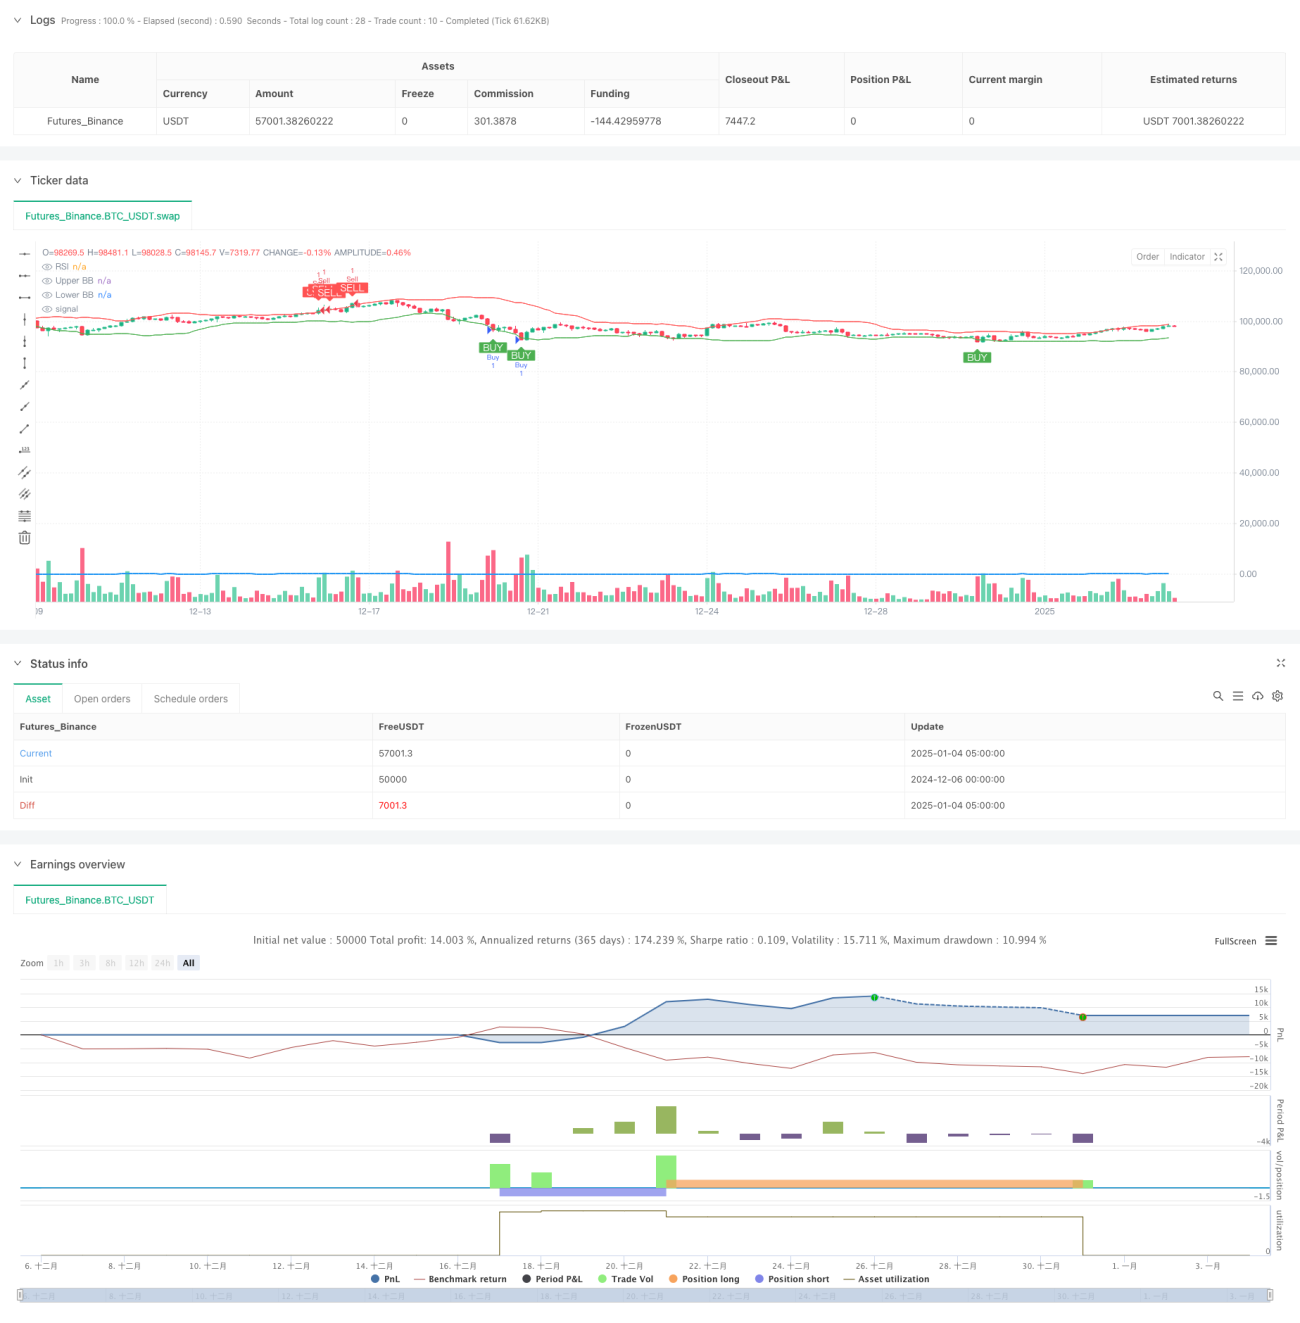
Esta estrategia es un sistema de negociación de reversión de impulso que combina los indicadores técnicos duales RSI y Bandas de Bollinger para negociar identificando áreas de sobrecompra y sobreventa. La estrategia utiliza una relación riesgo-rendimiento de 1:2 y combina un stop loss móvil para el control del riesgo. La lógica central es operar cuando tanto el RSI como las bandas de Bollinger muestran señales de sobrecompra o sobreventa al mismo tiempo y proteger los fondos mediante una estricta gestión de riesgos.
Principio de estrategia
La estrategia utiliza el RSI de 14 períodos y las bandas de Bollinger de 20 períodos como indicadores principales. Las condiciones de compra deben cumplirse simultáneamente: RSI está por debajo de 30 (sobreventa) y el precio toca o cae por debajo de la banda de Bollinger inferior. Las condiciones de venta deben cumplirse al mismo tiempo: RSI está por encima de 70 (sobrecompra) y el precio toca o supera la Banda de Bollinger superior. El sistema utiliza el punto más alto/más bajo de 5 líneas K como stop loss móvil, y la posición de toma de ganancias es el doble de la distancia del stop loss, implementando estrictamente una relación riesgo-retorno de 1:2.
Ventajas estratégicas
- El filtrado de índice técnico dual mejora la calidad de la señal y reduce las señales falsas
- Combinación de indicadores de impulso y volatilidad para proporcionar una perspectiva más completa del mercado
- Mecanismo estricto de control de riesgos, que incluye stop loss dinámico y una relación riesgo-rendimiento fija
- El sistema está completamente automatizado, eliminando la interferencia emocional humana.
- La lógica de la estrategia es clara, fácil de entender y mantener.
Riesgo estratégico
- Los stop loss pueden ser frecuentes en mercados con tendencia
- Las condiciones dobles pueden hacer perder algunas oportunidades comerciales
- Los parámetros RSI fijos y de bandas de Bollinger pueden no ser adecuados para todos los entornos de mercado
- Los trailing stops pueden llevar a salidas prematuras en mercados volátiles
- Se necesita una gestión razonable del dinero para hacer frente a pérdidas consecutivas.
Dirección de optimización de la estrategia
- Introducir un mecanismo de parámetros adaptativos para ajustar dinámicamente los parámetros del indicador según la volatilidad del mercado
- Se agregó un filtro de tendencia para suspender el trading de reversión en tendencias fuertes
- Desarrollar un sistema dinámico de relación riesgo-rendimiento y ajustarlo según las condiciones del mercado
- Añadir mecanismo de confirmación de volumen para mejorar la confiabilidad de la señal
- Implementar mecanismos de stop loss más flexibles, como el trailing stop loss o el time stop loss
Resumir
Esta es una estrategia de trading de reversión bien estructurada que utiliza indicadores técnicos duales para lograr una mayor precisión y emplea una estricta gestión de riesgos. Aunque la estrategia es simple e intuitiva, contiene los elementos clave necesarios para un sistema de trading maduro. A través de las direcciones de optimización sugeridas, esta estrategia tiene margen de mejora. En el trading real, se recomienda realizar primero pruebas retrospectivas suficientes y optimizar los parámetros.
- 1