Estrategia de canal Kenny de soporte y resistencia dinámicos de múltiples canales

KC EMA ATR SMA WMA PP SR
Fecha de creación: 2025-01-17 15:17:59 Última modificación: 2025-01-17 15:17:59
Copiar: 0 Número de Visitas: 337
1
Seguir
1617
Seguidores

Estrategia de canal Kenny de soporte y resistencia dinámicos de múltiples canales

Descripción general

La estrategia es un sistema de trading compuesto basado en el canal de Keltner y niveles dinámicos de soporte y resistencia. Forma un marco completo para la toma de decisiones comerciales analizando múltiples períodos de tiempo y combinando promedios móviles e indicadores de volatilidad. El núcleo de la estrategia es capturar oportunidades comerciales de alta probabilidad identificando el momento en que los precios rompen niveles técnicos clave, teniendo en cuenta las tendencias y la volatilidad del mercado.

Principio de estrategia

La estrategia utiliza un sistema de indicadores técnicos multicapa para el análisis:

  1. Utilice el canal Kenny de 21 períodos como la principal herramienta de determinación de tendencia, y el ancho del canal está determinado por el valor ATR.
  2. Calcule los niveles clave de soporte y resistencia utilizando 21 velas a la izquierda y 8 velas a la derecha
  3. Introducción de promedios móviles de períodos de tiempo de alto nivel como filtros de tendencia
  4. Combinación de promedios móviles de corto plazo (5 períodos) y largo plazo (30 períodos) para determinar el momento de entrada
  5. Utilice ATR para ajustar dinámicamente la posición de stop loss

Ventajas estratégicas

  1. Los indicadores técnicos multidimensionales se verifican entre sí y reducen eficazmente las señales falsas.
  2. Los niveles dinámicos de soporte y resistencia se actualizan en tiempo real para adaptarse a los cambios del mercado.
  3. Filtrar las tendencias del mercado secundario a través de un análisis de períodos de tiempo de alto nivel
  4. Ajuste de forma flexible los parámetros de stop loss según diferentes períodos de tiempo
  5. Utilice la gestión de posiciones porcentuales para controlar eficazmente los riesgos

Riesgo estratégico

  1. Se pueden generar señales comerciales frecuentes en un mercado volátil
  2. La verificación de múltiples indicadores puede provocar la pérdida de algunas oportunidades comerciales
  3. La optimización de parámetros tiene el riesgo de sobreajuste
  4. Los stops pueden ser demasiado amplios en entornos de alta volatilidad
  5. Los niveles de soporte y resistencia pueden volverse inválidos cuando el mercado cambia drásticamente.

Dirección de optimización de la estrategia

  1. Introducción de indicadores de volumen para ayudar a evaluar la eficacia de los avances
  2. Agregue un módulo de análisis de volatilidad del mercado y ajuste dinámicamente los parámetros
  3. Optimizar el método de cálculo de los niveles de soporte y resistencia para mejorar la precisión
  4. Agregue juicios sobre la fuerza de la tendencia y refine las condiciones de entrada
  5. Mejorar el sistema de gestión de posiciones para lograr un control de riesgos más sofisticado

Resumir

Se trata de una estrategia de trading cuantitativa con una estructura completa y una lógica rigurosa. Mediante el uso coordinado de múltiples capas de indicadores técnicos, se garantiza la confiabilidad de las señales comerciales y se logra un control efectivo del riesgo. La estrategia tiene una fuerte escalabilidad y se espera que mantenga un rendimiento estable en diferentes entornos de mercado a través de la optimización y mejora continuas.
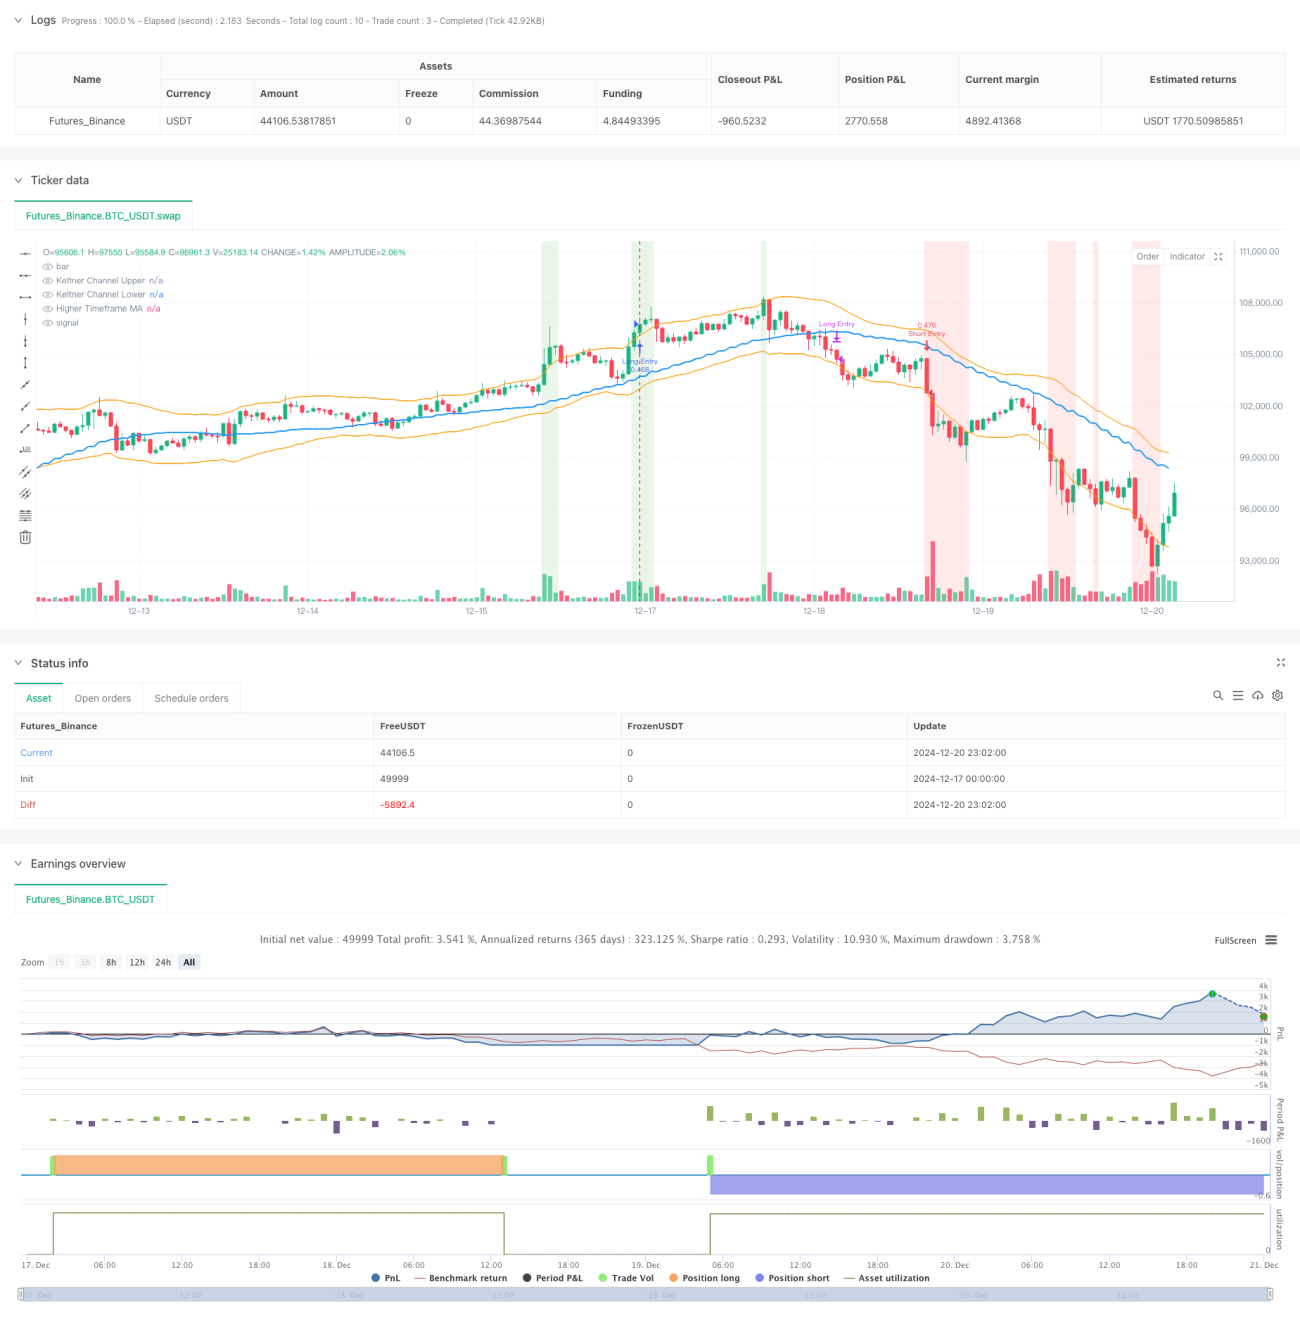
Código Fuente de la Estrategia
/*backtest
start: 2024-12-17 00:00:00
end: 2024-12-21 00:00:00
period: 1h
basePeriod: 1h
exchanges: [{"eid":"Futures_Binance","currency":"BTC_USDT","balance":49999}]
*/

// This Pine Script™ code is subject to the terms of the Mozilla Public License 2.0 at https://mozilla.org/MPL/2.0/
// © sathcm
//@version=5 
strategy("KMS", overlay=true, initial_capital=100000, default_qty_type=strategy.percent_of_equity, default_qty_value=100, commission_type=strategy.commission.percent, commission_value=0.05, slippage=3)

// Inputs for Keltner Channels
kcLength = input.int(21, title="Keltner Channel Length", minval=1)  // Length for Keltner Channel calculation
kcMultiplier = input.float(2.0, title="Keltner Channel Multiplier", minval=0.1)  // Multiplier for Keltner Channel width

// Calculate Keltner Channels using best practices
kcBasis = ta.ema(close, kcLength)  // Use EMA for a smoother basis line
atrValue = ta.atr(kcLength)  // Use ATR for channel width calculation
kcUpper = kcBasis + kcMultiplier * atrValue  // Upper Keltner Channel
kcLower = kcBasis - kcMultiplier * atrValue  // Lower Keltner Channel

// Inputs for Pivot Point Calculation
leftBars = input.int(21, title="Left Bars", minval=1)  // Number of bars to the left for pivot calculation
rightBars = input.int(8, title="Right Bars", minval=1, tooltip="Number of bars to the right for pivot calculation")  // Number of bars to the right for pivot calculation

// Calculate Smoothed Pivot Highs and Lows using Weighted Moving Average
pivotHigh = ta.pivothigh(high, leftBars, rightBars)  // Apply WMA for smoothing
pivotLow = ta.pivotlow(low, leftBars, rightBars)  // Apply WMA for smoothing

// Convert Pivot Highs and Lows to Boolean Conditions
isPivotHigh = not na(pivotHigh)  // True when a pivot high exists
isPivotLow = not na(pivotLow)  // True when a pivot low exists

// Get Recent Support and Resistance Levels
recentResistance = ta.valuewhen(isPivotHigh, high, 0)  // Most recent resistance level
recentSupport = ta.valuewhen(isPivotLow, low, 0)  // Most recent support level

// Plot Smoothed Support and Resistance Levels
//plot(recentResistance, color=color.red, title="Recent Resistance", linewidth=2, style=plot.style_line)
//plot(recentSupport, color=color.green, title="Recent Support", linewidth=2, style=plot.style_line)

// Store Entry Price into a Variable
var float entryPrice = na  // Declare a variable to store the entry price

// Input for Higher Timeframe
higherTimeframeInput = input.timeframe('W', title="Higher Timeframe for MA Calculation")

if (timeframe.period == "240") or (timeframe.period == "120")
    higherTimeframeInput := "D"
if (timeframe.period == "60") or (timeframe.period == "30") or (timeframe.period == "15")
    higherTimeframeInput := "120"
if (timeframe.period == "10") or (timeframe.period == "5") 
    higherTimeframeInput := "30"
if (timeframe.period == "1")
    higherTimeframeInput := "10"

prd = input.int(defval=10, title='Pivot Period', minval=4, maxval=30, group='Settings 🔨', tooltip='Used while calculating Pivot Points, checks left&right bars')
ppsrc = input.string(defval='High/Low', title='Source', options=['High/Low', 'Close/Open'], group='Settings 🔨', tooltip='Source for Pivot Points')
ChannelW = input.int(defval=5, title='Maximum Channel Width %', minval=1, maxval=8, group='Settings 🔨', tooltip='Calculated using Highest/Lowest levels in 300 bars')
minstrength = input.int(defval=1, title='Minimum Strength', minval=1, group='Settings 🔨', tooltip='Channel must contain at least 2 Pivot Points')
maxnumsr = input.int(defval=4, title='Maximum Number of S/R', minval=1, maxval=10, group='Settings 🔨', tooltip='Maximum number of Support/Resistance Channels to Show') - 1
loopback = input.int(defval=150, title='Loopback Period', minval=100, maxval=400, group='Settings 🔨', tooltip='While calculating S/R levels it checks Pivots in Loopback Period')
res_col = input.color(defval=color.new(color.red, 75), title='Resistance Color', group='Colors 🟡🟢🟣')
sup_col = input.color(defval=color.new(color.lime, 75), title='Support Color', group='Colors 🟡🟢🟣')
inch_col = input.color(defval=color.new(color.gray, 75), title='Color When Price in Channel', group='Colors 🟡🟢🟣')

// Get Pivot High/Low
src1 = ppsrc == 'High/Low' ? high : math.max(close, open)
src2 = ppsrc == 'High/Low' ? low : math.min(close, open)
ph = ta.pivothigh(src1, prd, prd)
pl = ta.pivotlow(src2, prd, prd)

// Calculate maximum S/R channel width
prdhighest = ta.highest(300)
prdlowest = ta.lowest(300)
cwidth = (prdhighest - prdlowest) * ChannelW / 100

// Get/keep Pivot levels
var pivotvals = array.new_float(0)
var pivotlocs = array.new_float(0)
if ph or pl
    array.unshift(pivotvals, ph ? ph : pl)
    array.unshift(pivotlocs, bar_index)
    for x = array.size(pivotvals) - 1 to 0 by 1
        if bar_index - array.get(pivotlocs, x) > loopback  // remove old pivot points
            array.pop(pivotvals)
            array.pop(pivotlocs)
            continue
        break

// Find/create SR channel of a pivot point
get_sr_vals(ind) =>
    float lo = array.get(pivotvals, ind)
    float hi = lo
    int numpp = 0
    for y = 0 to array.size(pivotvals) - 1 by 1
        float cpp = array.get(pivotvals, y)
        float wdth = cpp <= hi ? hi - cpp : cpp - lo
        if wdth <= cwidth  // fits the max channel width?
            if cpp <= hi
                lo := math.min(lo, cpp)
            else
                hi := math.max(hi, cpp)
            numpp += 20  // each pivot point added as 20
    [hi, lo, numpp]

// Keep old SR channels and calculate/sort new channels if we met new pivot point
var suportresistance = array.new_float(20, 0)  // min/max levels
changeit(x, y) =>
    tmp = array.get(suportresistance, y * 2)
    array.set(suportresistance, y * 2, array.get(suportresistance, x * 2))
    array.set(suportresistance, x * 2, tmp)
    tmp := array.get(suportresistance, y * 2 + 1)
    array.set(suportresistance, y * 2 + 1, array.get(suportresistance, x * 2 + 1))
    array.set(suportresistance, x * 2 + 1, tmp)

if ph or pl
    supres = array.new_float(0)  // number of pivot, strength, min/max levels
    stren = array.new_float(10, 0)
    // Get levels and strengths
    for x = 0 to array.size(pivotvals) - 1 by 1
        [hi, lo, strength] = get_sr_vals(x)
        array.push(supres, strength)
        array.push(supres, hi)
        array.push(supres, lo)

    // Add each HL to strength
    for x = 0 to array.size(pivotvals) - 1 by 1
        h = array.get(supres, x * 3 + 1)
        l = array.get(supres, x * 3 + 2)
        s = 0
        for y = 0 to loopback by 1
            if high[y] <= h and high[y] >= l or low[y] <= h and low[y] >= l
                s += 1
        array.set(supres, x * 3, array.get(supres, x * 3) + s)

    // Reset SR levels
    array.fill(suportresistance, 0)
    // Get strongest SRs
    src = 0
    for x = 0 to array.size(pivotvals) - 1 by 1
        stv = -1.  // value
        stl = -1  // location
        for y = 0 to array.size(pivotvals) - 1 by 1
            if array.get(supres, y * 3) > stv and array.get(supres, y * 3) >= minstrength * 20
                stv := array.get(supres, y * 3)
                stl := y
        if stl >= 0
            // Get SR level
            hh = array.get(supres, stl * 3 + 1)
            ll = array.get(supres, stl * 3 + 2)
            array.set(suportresistance, src * 2, hh)
            array.set(suportresistance, src * 2 + 1, ll)
            array.set(stren, src, array.get(supres, stl * 3))

            // Make included pivot points' strength zero
            for y = 0 to array.size(pivotvals) - 1 by 1
                if array.get(supres, y * 3 + 1) <= hh and array.get(supres, y * 3 + 1) >= ll or array.get(supres, y * 3 + 2) <= hh and array.get(supres, y * 3 + 2) >= ll
                    array.set(supres, y * 3, -1)

            src += 1
            if src >= 10
                break

    for x = 0 to 8 by 1
        for y = x + 1 to 9 by 1
            if array.get(stren, y) > array.get(stren, x)
                tmp = array.get(stren, y)
                array.set(stren, y, array.get(stren, x))
                changeit(x, y)

get_level(ind) =>
    float ret = na
    if ind < array.size(suportresistance)
        if array.get(suportresistance, ind) != 0
            ret := array.get(suportresistance, ind)
    ret

get_color(ind) =>
    color ret = na
    if ind < array.size(suportresistance)
        if array.get(suportresistance, ind) != 0
            ret := array.get(suportresistance, ind) > close and array.get(suportresistance, ind + 1) > close ? res_col : array.get(suportresistance, ind) < close and array.get(suportresistance, ind + 1) < close ? sup_col : inch_col
    ret

// var srchannels = array.new_box(10)
// for x = 0 to math.min(9, maxnumsr) by 1
//     box.delete(array.get(srchannels, x))
//     srcol = get_color(x * 2)
//     if not na(srcol)
//         array.set(srchannels, x, box.new(left=bar_index, top=get_level(x * 2), right=bar_index + 1, bottom=get_level(x * 2 + 1), border_color=srcol, border_width=1, extend=extend.both, bgcolor=srcol))

// Improved dynamic support detection
float recentSupport1 = na
float previousSupport = na
float currentsupport = na

if na(previousSupport) or currentsupport != previousSupport
    if array.size(suportresistance) > 1 
        for i = 0 to math.floor(array.size(suportresistance) / 2) - 1  // Iterate through support levels
            currentsupport := array.get(suportresistance, i * 2 + 1)  // Support is stored at odd indices
            if currentsupport < close and (na(recentSupport1) or math.abs(close - currentsupport) < math.abs(close - recentSupport1))
                previousSupport := currentsupport  // Store the newly detected support
                  // Set the most recent support to the new support
                recentSupport1 := na(recentSupport1) ? ta.lowest(low, 10) : currentsupport
// Moving averages for entry and exit
maShort = ta.sma(close, 5)
maLong = ta.sma(close, 30) + ta.atr(14)
// Track entry price
entryPrice1 = strategy.position_avg_price  // Get the price of the currently open position
currentTimeFrame = timeframe.period
exitPrice = entryPrice1 * 0.99

if currentTimeFrame == "1H" or currentTimeFrame == "30" or currentTimeFrame == "15" or currentTimeFrame == "5"
    exitPrice := entryPrice1 * 0.99  // Set the exit price at 99% of the entry price

if currentTimeFrame == "120" or currentTimeFrame == "180" or currentTimeFrame == "240" or currentTimeFrame == "D"
    exitPrice := entryPrice1 * 0.98 // Set the exit price at 95% of the entry price


// Calculate Moving Average based on higher timeframe for length of 20 bars
higherTimeframeMA = request.security(syminfo.tickerid, higherTimeframeInput, ta.sma(close, 20), barmerge.gaps_off, barmerge.lookahead_on)  // Calculate MA with adjusted timeframe

// Entry and Exit Conditions for Long
entryLong = (close > kcUpper) and (close > recentResistance) and (close > higherTimeframeMA)  // Long entry when price breaks above KC upper, recent resistance, and higher timeframe MA
exitLong = (close < recentResistance - 1.5*atrValue)  // Long exit when price falls below recent resistance with cushion of one ATR

// Entry and Exit Conditions for Short
entryShort = (close < kcLower) and (close < recentSupport) and (close < higherTimeframeMA+atrValue) // Add RSI filter to reduce false signals by confirming momentum  // Short entry when price breaks below KC lower, recent support, and higher timeframe MA
exitShort = (close > recentSupport + atrValue)  // Short exit when price rises above recent support with cushion of one ATR(close > recentSupport + atrValue)  // Short exit when price rises above recent support with cushion of one ATR(close > recentSupport + atrValue)  // Short exit when price rises above recent support with cushion of one ATR

// Strategy Execution for Long
if not na(recentSupport1) and (close <= recentSupport1 +(close*0.01) or close >= recentSupport1 - (close*0.0075)) and (maShort > maLong) and entryLong
    strategy.entry("Long Entry", strategy.long)
    //entryPrice := strategy.position_avg_price  // Store the entry price when a position is opened

if ((maShort < maLong + 3*ta.atr(14)) or  close < exitPrice) and exitLong
    strategy.close("Long Entry")

// Strategy Execution for Short
if entryShort
    strategy.entry("Short Entry", strategy.short)
    entryPrice := strategy.position_avg_price  // Store the entry price when a position is opened

if exitShort
    strategy.close("Short Entry")

// Plot Keltner Channels
plot(kcUpper, color=color.orange, title="Keltner Channel Upper", linewidth=1)
plot(kcLower, color=color.orange, title="Keltner Channel Lower", linewidth=1)

// Plot Moving Averages
plot(higherTimeframeMA, color=color.blue, title="Higher Timeframe MA", linewidth=2)

//plot(recentSupport1, color=#04313f, title="Recent Support1")
//plot(recentResistance, color=color.purple, title="Recent Resistance")
//plot(entryPrice1, color=color.lime, title="Entry Price 1")
//plot(exitPrice, color=color.maroon, title="Exit Price")
//plot(maShort, color=color.green, title="MA Short")
//plot(maLong, color=color.blue, title="MA Long Plus ATR")

// Highlight Entry Zones
bgcolor(entryLong ? color.new(color.green, 85) : na, title="Long Entry Zone")
bgcolor(entryShort ? color.new(color.red, 85) : na, title="Short Entry Zone")

// Alerts
alertcondition(entryLong, title="Long Entry", message="Price broke above the Keltner Channel and recent resistance for Long Entry")
alertcondition(exitLong, title="Long Exit", message="Price fell below recent resistance with cushion of one ATR - Long Exit")
alertcondition(entryShort, title="Short Entry", message="Price broke below the Keltner Channel and recent support for Short Entry")
alertcondition(exitShort, title="Short Exit", message="Price rose above recent support with cushion of one ATR - Short Exit")