Estrategia de seguimiento de tendencias de impulso cruzado con múltiples indicadores técnicos

Descripción general
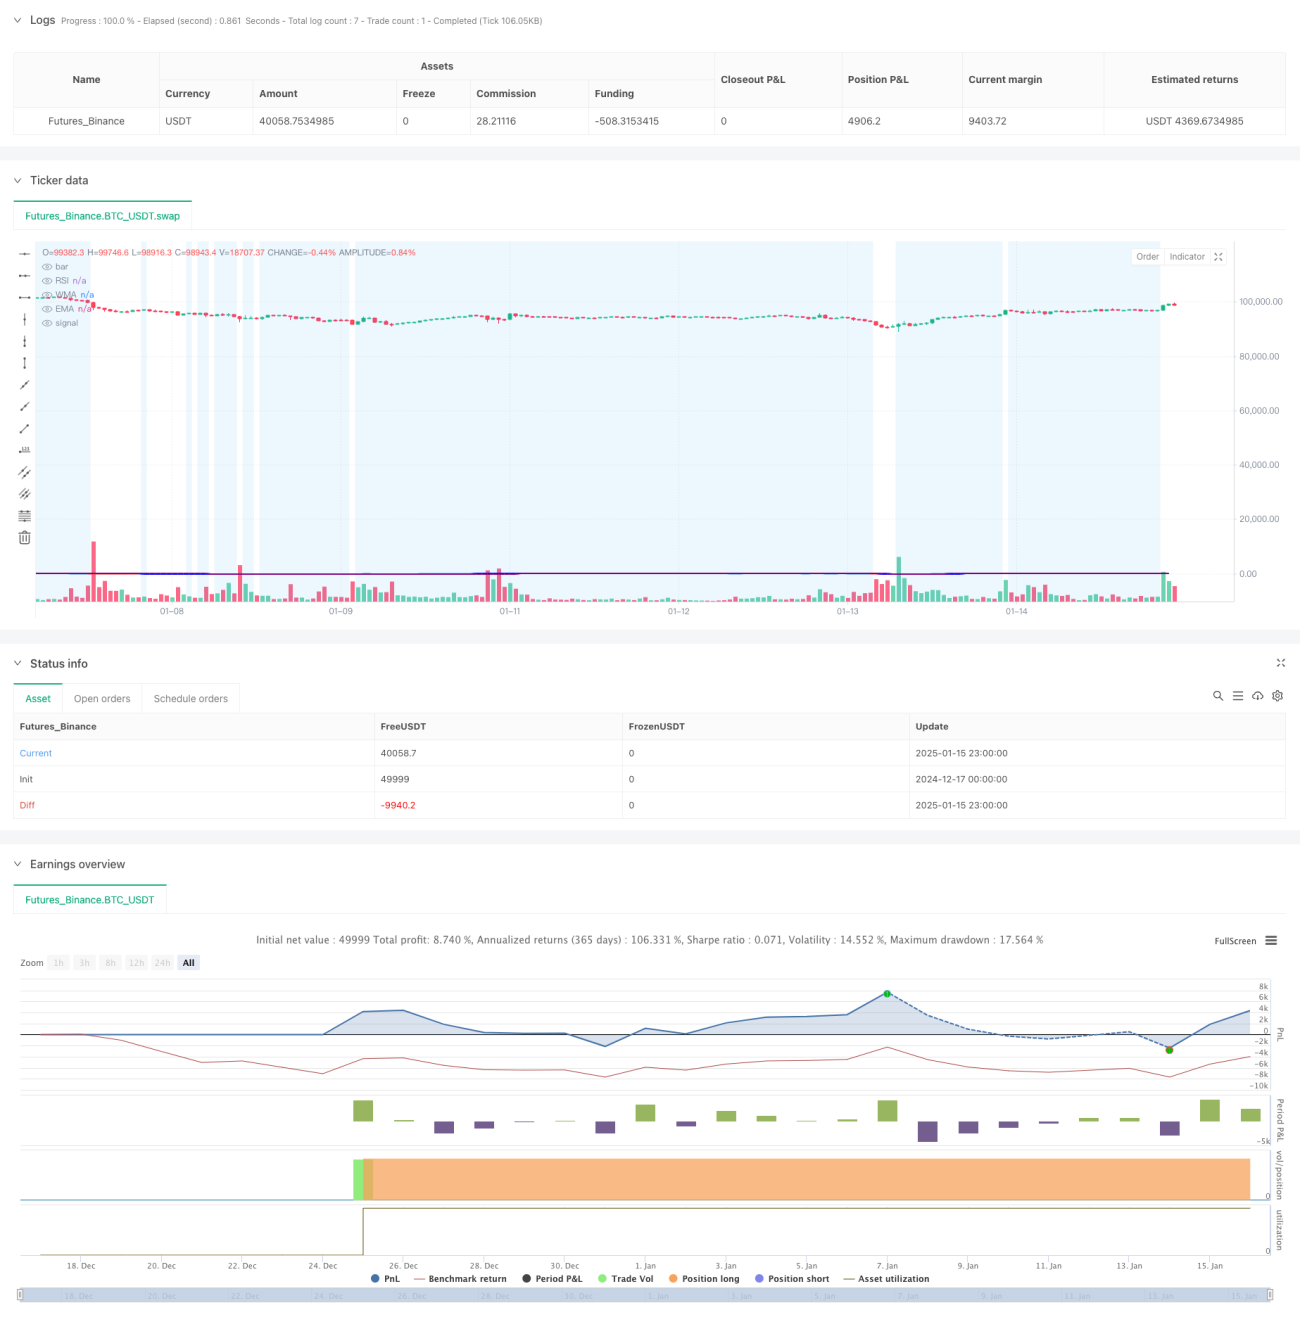
La estrategia es un sistema de trading de seguimiento de tendencias que combina el índice de fuerza relativa (RSI), la media móvil ponderada (WMA) y la media móvil exponencial (EMA). La estrategia utiliza múltiples indicadores técnicos en coordinación para capturar cambios en el impulso del mercado en los puntos de inflexión de la tendencia, generando así señales comerciales. El sistema utiliza el cruce de WMA y EMA para confirmar la dirección de la tendencia y combina el indicador RSI para filtrar el estado del mercado para mejorar la precisión de las transacciones.
Principio de estrategia
La lógica central de la estrategia se basa en los siguientes elementos clave:
- El indicador RSI se calcula utilizando un período de 14 períodos para medir las condiciones de sobrecompra y sobreventa del mercado.
- El cruce de la WMA de 45 períodos y la EMA de 89 períodos se utiliza para confirmar un cambio de tendencia.
- Condiciones de entrada:
- Señal larga: WMA cruza por encima de EMA y RSI < 50
- Señal corta: WMA cruza por debajo de EMA y RSI>50
- El sistema visualiza el estado del mercado a través del cambio de color del RSI. Cuando el RSI es >70, se muestra en verde, y cuando es <30, se muestra en rojo.
- Se establece un fondo azul en el rango RSI 30-70 para ayudar a identificar áreas neutrales.
Ventajas estratégicas
- La combinación de múltiples indicadores técnicos mejora la confiabilidad de las señales comerciales.
- La WMA responde mejor a los cambios de precios recientes, mientras que la EMA sigue la tendencia a largo plazo.
- El RSI actúa como un filtro para evitar eficazmente señales falsas en mercados demasiado volátiles.
- El diseño de la interfaz visual ayuda a los comerciantes a juzgar intuitivamente el estado del mercado.
- Incluye un sistema de alerta completo para notificar rápidamente a los comerciantes sobre posibles oportunidades comerciales.
Riesgo estratégico
- En un mercado lateral pueden producirse frecuentes señales de ruptura falsas.
- El retraso del promedio móvil puede provocar un ligero retraso en el momento de entrada.
- Las configuraciones fijas para los umbrales RSI pueden no ser apropiadas en todos los entornos de mercado
- No tener en cuenta los factores de volatilidad puede aumentar el riesgo durante períodos de alta volatilidad.
- La falta de mecanismos de stop loss y stop profit puede afectar el efecto de la gestión de fondos
Dirección de optimización de la estrategia
- Introducción de umbrales RSI adaptativos para ajustarse dinámicamente según las fluctuaciones del mercado
- Agregue el indicador ATR para controlar el tamaño de la posición y establecer un stop loss dinámico
- Optimice la configuración del período WMA y EMA y considere ajustarlos según diferentes períodos de tiempo
- Añadir indicador de volumen como señal de confirmación auxiliar
- Implementar sistemas de gestión de posiciones más complejos, como piramidación y reducción de posiciones.
Resumir
Se trata de una estrategia de seguimiento de tendencias basada en múltiples indicadores técnicos. Mediante el uso coordinado de RSI, WMA y EMA, busca capturar los puntos de inflexión de la tendencia del mercado al tiempo que garantiza la estabilidad de las operaciones. Si bien existen ciertos riesgos de histéresis y señales falsas, mediante medidas razonables de optimización y gestión de riesgos, esta estrategia tiene un buen valor práctico y espacio de expansión.
- 1