
Descripción general
Se trata de un sistema de comercio de seguimiento de tendencias basado en múltiples indicadores, que combina varios indicadores técnicos, como el promedio móvil (EMA), el indicador MACD, el indicador RSI y el análisis de la transacción. La estrategia analiza la relación entre las medias móviles a corto, medio y largo plazo, combinando el indicador de movimiento y la confirmación de la transacción, para negociar cuando la tendencia del mercado es clara.
Principio de estrategia
La estrategia se basa en los siguientes elementos centrales:
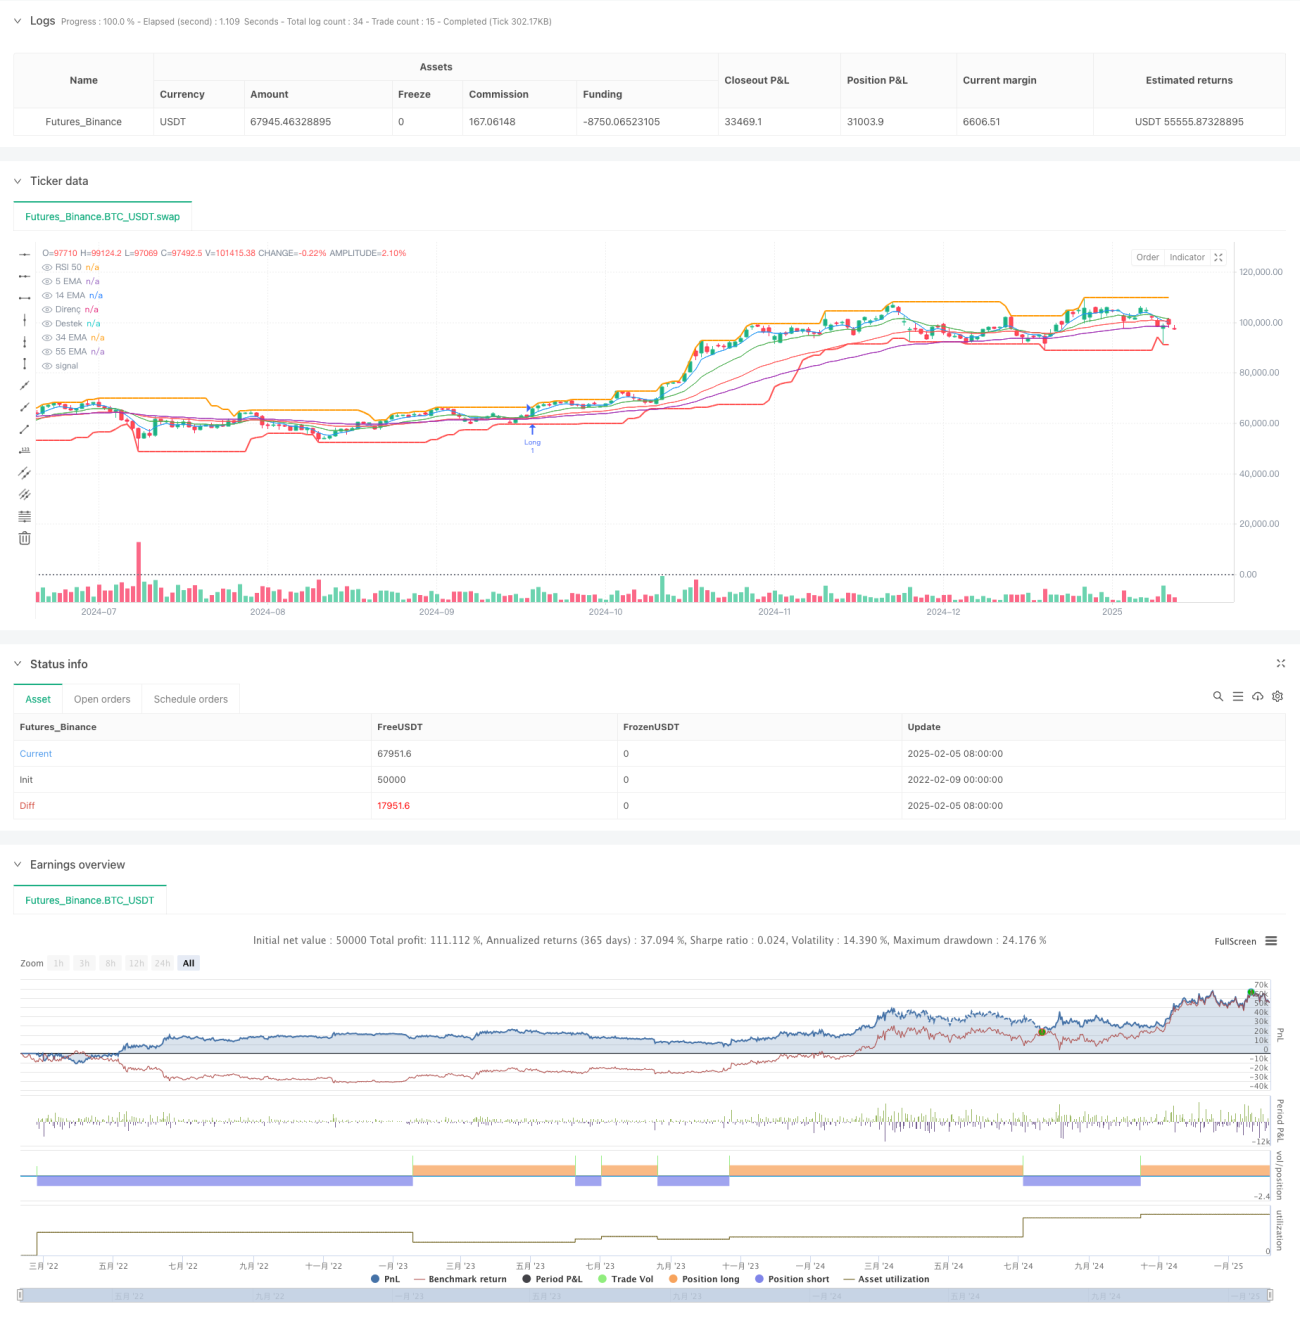
- Sistema de EMA múltiple: utiliza EMA de 5, 14, 34 y 55 ciclos para confirmar la dirección de la tendencia mediante la alineación de la línea media. Cuando la línea media de corto período está por encima de la línea media de largo período, se considera una tendencia alcista; al contrario, una tendencia descendente.
- Indicador MACD: Se utiliza para confirmar la dinámica del mercado. Cuando el gráfico MACD es positivo, indica una fuerte dinámica ascendente; cuando es negativo, indica una fuerte dinámica descendente.
- Indicador RSI: como un indicador de confirmación de la fortaleza del mercado. Un RSI mayor a 50 indica que el mercado está en una zona de fortaleza, y menor a 50 indica que el mercado está en una zona de debilidad.
- Análisis de volumen de transacciones: requiere un volumen de transacciones mayor a 1.5 veces el promedio de volumen de transacciones en 20 ciclos para asegurar que el mercado tenga suficiente actividad comercial.
- Resistencia de soporte: determina la resistencia de soporte a corto plazo mediante el cálculo de los precios máximos y mínimos de 20 ciclos.
Ventajas estratégicas
- Análisis multidimensional: reduce el riesgo de señales falsas mediante la combinación de varios indicadores técnicos.
- Confirmación de tendencias: el uso de sistemas de líneas medias múltiples permite un juicio más preciso de las tendencias del mercado.
- Validación de la dinámica: Con el uso de la combinación de MACD y RSI, se confirma la tendencia y se evita la persecución de las altas y bajas.
- Combinación de precio y cantidad: La combinación de precio y cantidad como condición necesaria para la confirmación de la transacción aumenta la fiabilidad de la transacción.
- Control de riesgos: proporciona referencia para el control de pérdidas mediante el análisis de los puntos de resistencia de soporte.
Riesgo estratégico
- Riesgo de mercado en movimiento: Las falsas señales pueden ser frecuentes en mercados en movimiento horizontal.
- Riesgo de retraso: la estrategia tiene cierto retraso debido al uso de múltiples medias móviles.
- Riesgo de costos: las transacciones frecuentes pueden generar costos de transacción más altos.
- Dependencia del entorno del mercado: la estrategia funciona mejor en un mercado de tendencia fuerte, pero puede funcionar mal en otros entornos del mercado.
Dirección de optimización de la estrategia
- Optimización de parámetros: se puede optimizar el parámetro de ciclo de cada indicador a través de la retroalimentación de datos históricos.
- Optimización de stop loss: agregar mecanismos de stop loss dinámicos, como stop loss de seguimiento o stop loss basados en ATR.
- Clasificación del entorno de mercado: agregar módulos de juicio del entorno de mercado, usar diferentes parámetros de negociación en diferentes entornos de mercado.
- Filtración de señales: aumenta el filtro de intensidad de tendencia para evitar el comercio en un entorno de tendencia débil.
- Gestión de posiciones: Introducción de un mecanismo dinámico de gestión de posiciones, que ajusta el porcentaje de tenencia de las posiciones según la intensidad de la señal.
Resumir
La estrategia es un sistema integrado de seguimiento de tendencias, mediante el uso combinado de múltiples indicadores técnicos, que garantiza la fiabilidad de las operaciones y al mismo tiempo tiene cierta capacidad de control de riesgos. La estrategia tiene una ventaja central en su método de análisis multidimensional, pero también requiere atención al impacto del entorno del mercado en el rendimiento de la estrategia.
- 1