Estrategia de reversión de pivote de múltiples marcos temporales y sistema de stop-profit y stop-loss dinámico porcentual

Descripción general
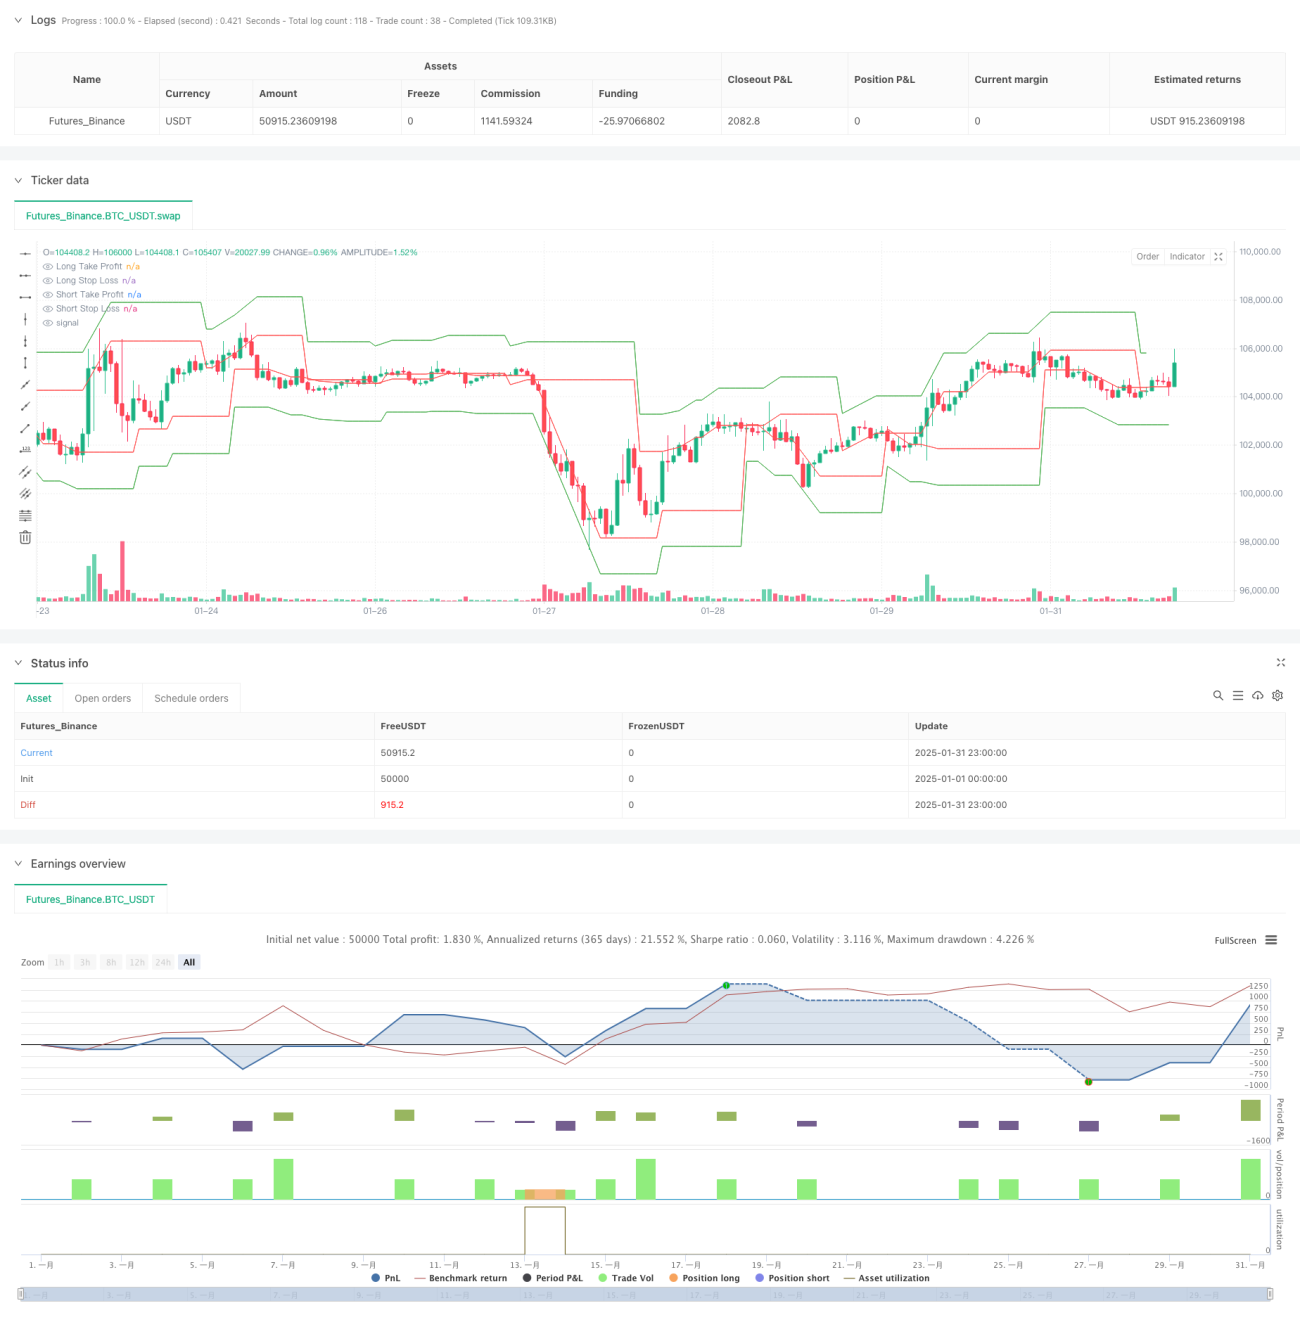
La estrategia es un sistema de negociación avanzado basado en análisis de múltiples períodos de tiempo, que captura oportunidades de reversión del mercado mediante la identificación de puntos centrales clave en períodos de tiempo más altos. La estrategia combina un mecanismo de stop loss de porcentaje dinámico para controlar el riesgo de manera efectiva y buscar ganancias estables. El sistema también incluye control de intervalo de negociación y funciones de prueba de rango de tiempo, lo que lo hace más adecuado para un entorno de negociación de disco real.
Principio de estrategia
La lógica central de la estrategia se basa en los siguientes elementos clave:
- El análisis de puntos cardinales se utiliza en períodos de tiempo más largos (de 60 minutos por defecto) para definir las condiciones de formación de los centros a través de los parámetros leftBars y rightBars.
- Gestiona el riesgo y los objetivos de ganancias de cada operación mediante el cálculo dinámico de la posición de stop-loss en porcentaje.
- El análisis de ciclo de tiempo múltiple proporciona un juicio más fiable de la estructura del mercado y reduce las señales falsas.
- El mecanismo de control del intervalo de transacción (por defecto 1440 minutos) evita el exceso de transacciones y mejora la calidad de la señal.
- La función de prueba de rango de tiempo permite la verificación de estrategias en un rango histórico específico.
Ventajas estratégicas
- El análisis de ciclo de tiempo múltiple ofrece una visión más completa del mercado y reduce las falsas rupturas.
- El porcentaje dinámico de stop loss se adapta a diferentes entornos de mercado y mejora la estabilidad de la estrategia.
- El control del intervalo de transacción es efectivo para evitar el exceso de transacciones y reducir los costos de las transacciones.
- La función de prueba de rango de tiempo facilita la optimización de la estrategia y el análisis del rendimiento histórico.
- La estructura del código es clara, fácil de mantener y modificar.
Riesgo estratégico
- En un mercado muy volátil, el porcentaje fijo de stop loss puede ser poco flexible.
- El intervalo de negociación más largo puede perder parte de la señal válida.
- El retraso en la identificación de los puntos centrales puede haber provocado que el tiempo de entrada no sea lo suficientemente óptimo.
- En el mercado horizontal puede haber demasiadas señales falsas.
Dirección de optimización de la estrategia
- Introducción de un indicador de fluctuación adaptativo para ajustar dinámicamente el porcentaje de pérdidas de parada.
- Añadir filtros de entornos de mercado para ajustar los parámetros de estrategia según la intensidad de las diferentes tendencias.
- Integración de análisis de tráfico para mejorar la fiabilidad de la señal de entrada.
- Realizar un ajuste intermitente de las transacciones dinámicas basadas en las fluctuaciones del mercado.
- La inclusión de la protección del mecanismo móvil de suspensión de pérdidas ha sido muy beneficiosa.
Resumir
La estrategia proporciona un marco completo para el sistema de negociación a través de análisis de múltiples ciclos de tiempo y gestión de riesgos dinámicos. Si bien hay algunos lugares que necesitan ser optimizados, el concepto de diseño general es razonable y tiene una buena practicidad. A través de la orientación de optimización sugerida, la estrategia espera obtener un rendimiento más estable en diferentes entornos de mercado.
- 1