
Descripción general
La estrategia es un innovador sistema de trading de seguimiento de tendencias que utiliza una tecnología de doble nivel de suavización del índice para identificar las tendencias del mercado. El sistema genera dos líneas de tendencia para capturar los movimientos a corto y largo plazo del mercado mediante un tratamiento especial de suavización del índice de los datos de precios. El sistema integra un módulo completo de gestión de riesgos, que incluye la configuración de stop-loss, y una función flexible de administración de posiciones.
Principio de estrategia
El núcleo de la estrategia es su exclusivo algoritmo de suavización de índices en dos niveles. En primer lugar, el sistema usa un tratamiento ponderado del precio de cierre, calculado como:*Se calcula la curva de suavización de 9 y 30 ciclos respectivamente mediante una función de suavización de índices personalizada. Cuando la curva de corto plazo atraviesa la curva de largo plazo, el sistema genera una señal de negociación.
Ventajas estratégicas
- El mecanismo de generación de señales es claro, adopta el concepto clásico de seguimiento de tendencias, es fácil de entender y ejecutar.
- La tecnología de suavización de doble capa puede filtrar el ruido del mercado y mejorar la calidad de la señal.
- Integración de un sistema completo de gestión de riesgos, incluido el Stop Loss y la gestión de posiciones.
- El sistema puede adaptarse a diferentes entornos de mercado y se aplica a varias variedades de transacciones.
- El mercado de divisas es un mercado de divisas en el que los inversores tienen una gran cantidad de opciones de divisas, lo que permite a los inversores determinar rápidamente la dirección del mercado.
Riesgo estratégico
- En los mercados convulsionados, pueden producirse frecuentes falsas señales, lo que provoca pérdidas continuas.
- Por defecto, el 100% del capital se utiliza para el comercio, y el exceso de apalancamiento puede suponer un mayor riesgo.
- La configuración de stop loss con un número fijo de puntos puede no ser adecuada para todos los entornos de mercado.
- El sistema puede sufrir deslizamientos en mercados con gran volatilidad, lo que puede afectar la ejecución.
- Los resultados de las evaluaciones anteriores no garantizan el rendimiento futuro.
Dirección de optimización de la estrategia
- Introducción de indicadores de volatilidad (como ATR) para ajustar dinámicamente el punto de parada.
- Aumentar los filtros de intensidad de tendencia y reducir la frecuencia de las transacciones en un entorno de tendencia débil.
- Se añade un módulo de reconocimiento de entornos de mercado para ajustar automáticamente los parámetros de la estrategia en mercados convulsionados.
- Desarrollar un sistema de gestión de posiciones dinámicas que ajuste automáticamente el tamaño de las transacciones según las condiciones del mercado.
- Integrar módulos de análisis fundamental para mejorar la precisión de las decisiones comerciales.
Resumir
Se trata de un sistema de seguimiento de tendencias de diseño razonable y con claridad lógica. La estrategia puede funcionar bien en un mercado de tendencias a través de la tecnología de suavización de índices en dos capas y un sistema completo de gestión de riesgos. Sin embargo, los usuarios deben ajustar el tamaño de las posiciones según su capacidad de asumir el riesgo y se recomienda realizar una verificación de retroalimentación adecuada antes de operar en el mercado real.
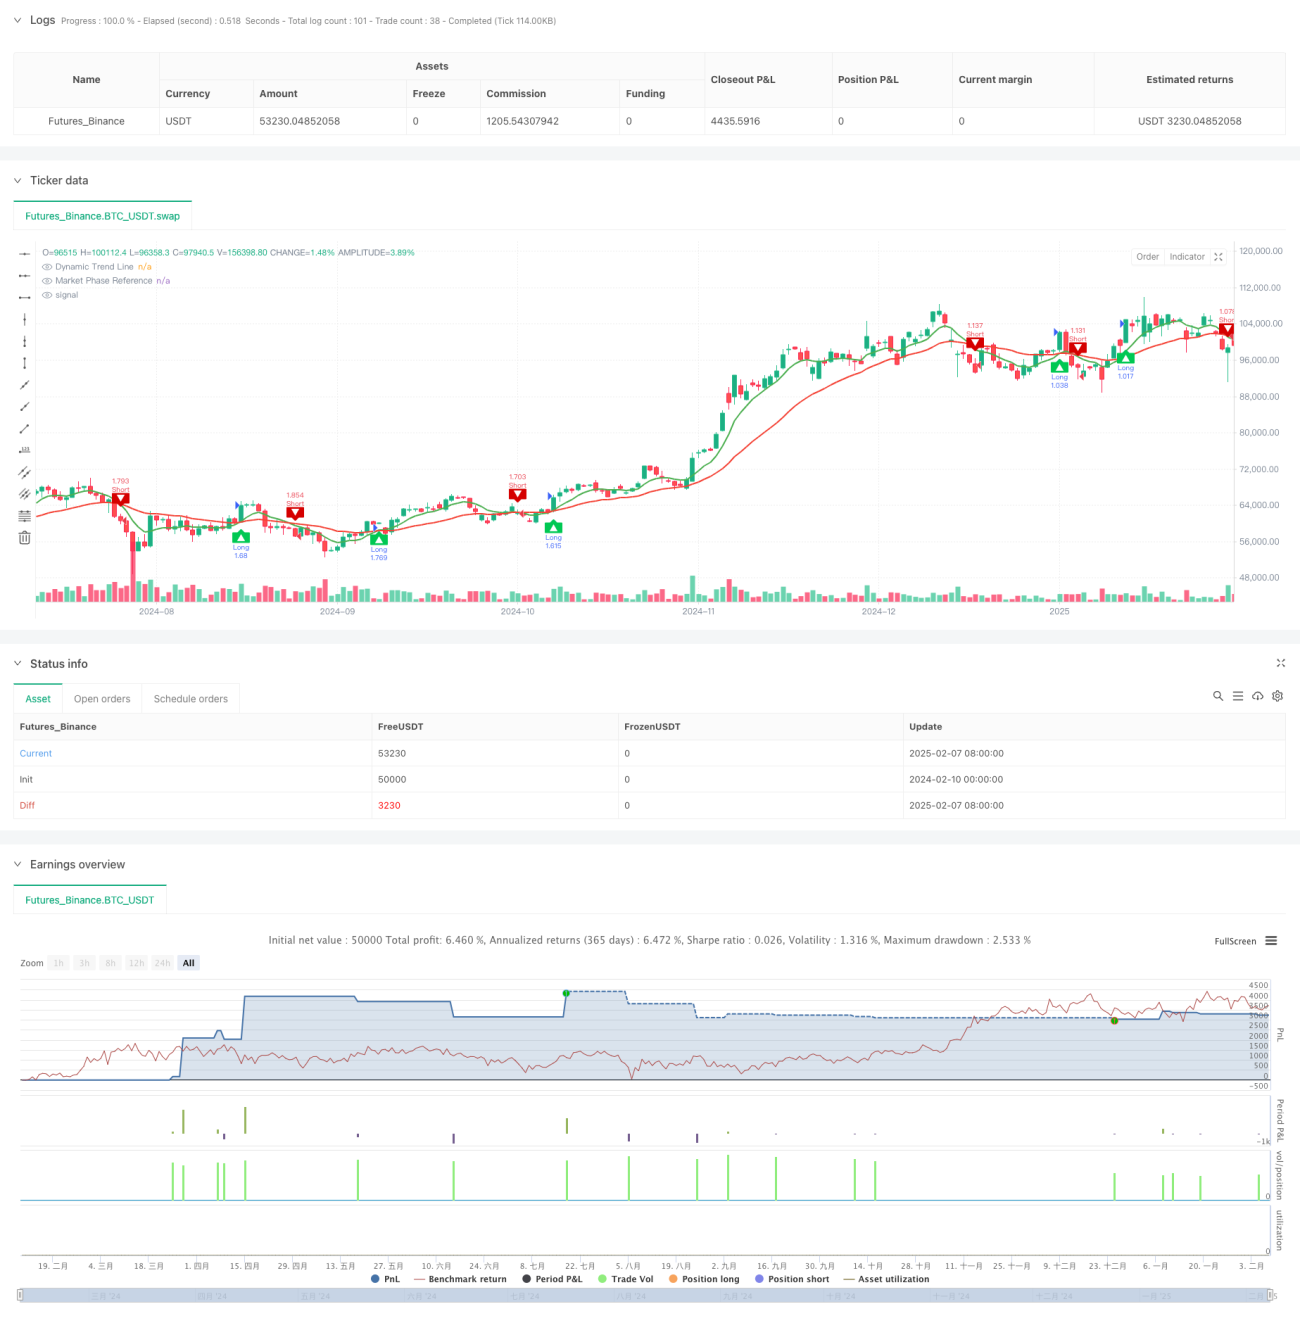
/*backtest
start: 2024-02-10 00:00:00
end: 2025-02-08 08:00:00
period: 1d
basePeriod: 1d
exchanges: [{"eid":"Futures_Binance","currency":"BTC_USDT"}]
*/

//@version=5
strategy("Dynamic Trend Navigator AI [CodingView]", overlay=true, initial_capital=100000, default_qty_type=strategy.percent_of_equity , default_qty_value=200 )
- 1