Estrategia de impulso de tendencia: sistema de cronometraje de banda dinámica multiperíodo en zigzag

Descripción general
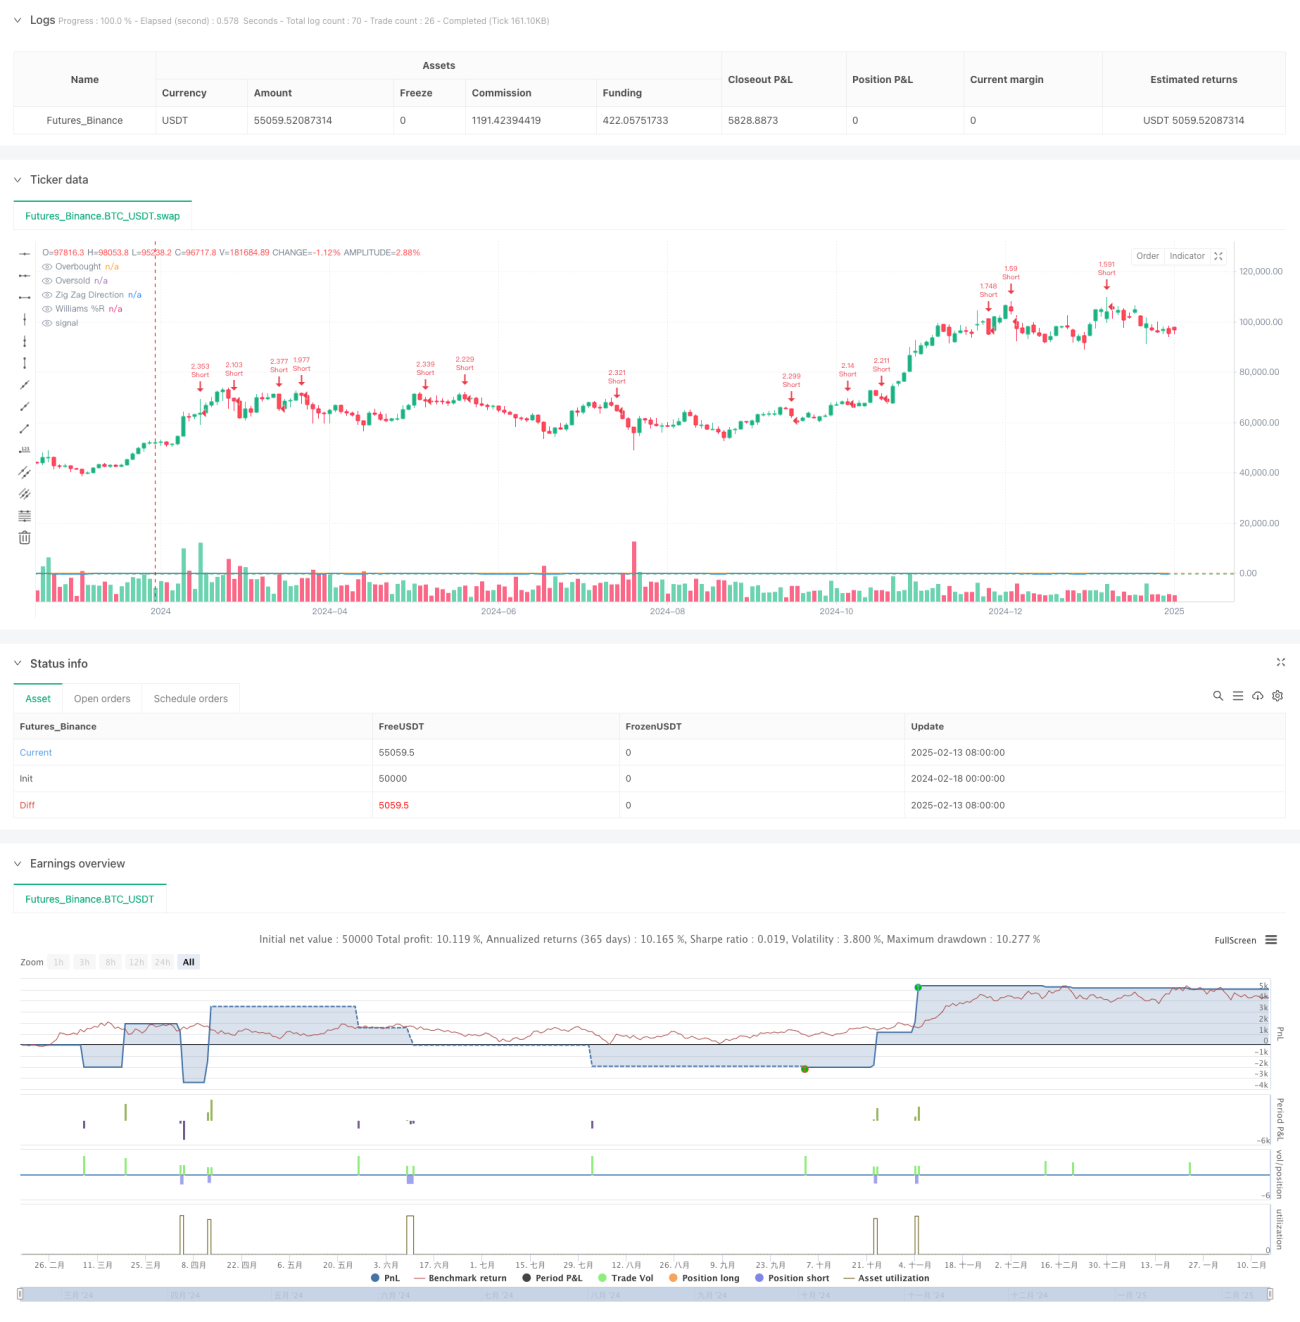
La estrategia es un sistema de negociación multidimensional que combina el indicador ZigZag y el indicador William. A través del indicador ZigZag, se identifican los altos y bajos de las bandas importantes, y se utiliza el indicador William para confirmar los puntos de entrada cuando el mercado alcanza un estado de sobrecompra o sobreventa. Esta combinación no solo puede capturar los principales puntos de cambio de tendencia del mercado, sino que también puede mejorar la precisión de las operaciones mediante la confirmación de la dinámica.
Principio de estrategia
La lógica central de la estrategia se basa en dos componentes principales:
- El indicador literal identifica los puntos altos y bajos de la banda significativa a través de la profundidad y los parámetros de desviación establecidos, filtra el ruido del mercado y determina la dirección de la tendencia. Cuando se forma un nuevo punto bajo de la banda, indica el comienzo de una tendencia alcista, y un nuevo punto alto de la banda indica el comienzo de una tendencia descendente.
- El índice William calcula el estado de la dinámica del mercado comparando el precio actual con el precio más alto en un período determinado. Cuando el índice supera los 80 indica sobreventa (oportunidad potencial de compra), y el descenso de 20 indica sobreventa (oportunidad potencial de venta).
Las reglas de negociación de la estrategia son las siguientes:
- Multicondicionamiento: el WYSIWYG identifica un nuevo nivel bajo de la banda y el WYSIWYG rompe hacia arriba desde la zona de sobreventa
- Condiciones de vacío: el indicador de palabras identifica un nuevo punto alto de la banda y el indicador de William se rompe hacia abajo desde la zona de sobrecompra
- El stop loss está en el 1% y el stop loss está en el 2%.
Ventajas estratégicas
- Confirmación multidimensional: mejora la fiabilidad de las señales de negociación mediante la doble confirmación de tendencias y dinámicas
- Adaptabilidad: los parámetros de desviación de los indicadores en forma de palabras se pueden ajustar a la fluctuación dinámica del mercado
- Control de riesgo perfecto: estrategia de stop loss con porcentaje fijo para controlar el riesgo de cada operación
- Buena visualización: muestra claramente las señales de negociación a través de etiquetas y gráficos para facilitar su análisis y optimización
Riesgo estratégico
- Riesgo de un mercado convulso: Falsas brechas frecuentes en el mercado horizontal
- Riesgo de deslizamiento: Es posible que haya un deslizamiento mayor en un trayecto rápido
- Sensibilidad de parámetros: la elección de los parámetros indicadores tiene un mayor impacto en el rendimiento de la estrategia
- Lagrangea de la señal: es posible que se pierda algo de velocidad debido a la necesidad de confirmar la formación de nuevos puntos de banda
Dirección de optimización de la estrategia
- Aumentar el filtro de entornos de mercado: se puede agregar un indicador de volatilidad para identificar el estado del mercado, utilizando diferentes configuraciones de parámetros en diferentes entornos
- Optimización de stop loss dinámico: se puede ajustar la posición de stop loss dinámicamente en función del ATR o de la volatilidad
- Introducir confirmación de transacción: agregar verificación de transacción cuando se genera la señal
- Filtrado de tiempo: se puede agregar un filtro de período de negociación para evitar el comercio en períodos de mayor volatilidad
Resumir
Se trata de un sistema de negociación completo que combina el seguimiento de tendencias y el comercio de volúmenes. A través de la sinergia de múltiples indicadores técnicos, se puede controlar el riesgo de manera efectiva y al mismo tiempo mantener una alta tasa de ganancias. Si bien existe un cierto retraso, se puede lograr un efecto de negociación estable a través de una racional optimización de los parámetros y la gestión del riesgo.
/*backtest
start: 2024-02-18 00:00:00
end: 2025-02-15 08:00:00
period: 2d
basePeriod: 2d
exchanges: [{"eid":"Futures_Binance","currency":"BTC_USDT"}]
*/

//@version=6
strategy("Zig Zag + Williams %R Strategy", overlay=true, default_qty_type=strategy.percent_of_equity, default_qty_value=300)

// ====================- 1