
Descripción general
La estrategia es un sistema de negociación de seguimiento de tendencias basado en las ondas de Gauss y el indicador StochRSI. La estrategia identifica las tendencias del mercado a través del canal de Gauss y se combina con el indicador StochRSI para optimizar el tiempo de entrada. El sistema utiliza un método de fusión múltiple para construir el canal de Gauss y seguir las tendencias de los precios mediante la adaptación dinámica de la trayectoria ascendente, lo que permite un seguimiento preciso de la evolución del mercado.
Principio de estrategia
El núcleo de la estrategia es un canal de precios basado en el algoritmo de Gauss. La implementación en concreto incluye los siguientes pasos clave:
- Utiliza la función polinomial f_filt9x para implementar las ondas de filtro de Gauss de grado 9, mejorando el efecto de filtro mediante la optimización de puntos
- Línea de onda principal y canal de fluctuación basado en el precio de HLC3
- La introducción de Reduced Lag reduce la latencia del filtro y el modo FastResponse mejora la velocidad de respuesta
- Se utiliza el indicador StochRSI para determinar las señales de negociación en el rango de sobrecompra y sobreventa (80/20)
- Cuando el canal de Gauss se eleva y el precio se desvía, la combinación del indicador StochRSI genera una señal de acción múltiple
- Cuando el precio cae en la vía de la salida a la bolsa
Ventajas estratégicas
- Las ondas de Gauss tienen una excelente capacidad de reducción de ruido, que puede filtrar eficazmente el ruido del mercado
- Reduce las señales falsas para lograr un seguimiento suave de las tendencias a través de la combinación de múltiples fórmulas
- Soporta la optimización de la latencia y el modo de respuesta rápida, adaptable a las características del mercado
- Optimización de la hora de entrada en combinación con el indicador StochRSI para mejorar la tasa de éxito de las operaciones
- Utiliza el ancho de canal dinámico para adaptarse a los cambios en la volatilidad del mercado
Riesgo estratégico
- Hay un cierto retraso en la llegada o salida de Gauss.
- Las señales de transacción frecuentes pueden generarse en mercados convulsionados, aumentando los costos de las transacciones.
- El StochRSI puede generar señales de retraso en ciertas condiciones de mercado
- El proceso de optimización de parámetros es complejo y requiere reajustes de parámetros en diferentes entornos de mercado
- El sistema requiere recursos de computación más altos, y el cómputo en tiempo real tiene un cierto retraso
Dirección de optimización de la estrategia
- Introducción de un mecanismo de optimización de parámetros de adaptación que ajuste los parámetros de forma dinámica según las condiciones del mercado
- Aumentar el módulo de identificación del entorno de mercado para usar diferentes combinaciones de parámetros en diferentes condiciones de mercado
- Optimización del algoritmo de las ondas de Gauss para reducir aún más los retrasos en los cálculos
- Introducción de más indicadores técnicos para la verificación cruzada y mejora de la fiabilidad de la señal
- Desarrollo de mecanismos inteligentes de detención de pérdidas para mejorar la capacidad de control de riesgos
Resumir
La estrategia, a través de la combinación de las ondas de Gauss y el indicador StochRSI, permite un seguimiento eficaz de las tendencias del mercado. El sistema tiene una buena capacidad de reducción de ruido y de identificación de tendencias, pero también existe cierto retraso y dificultad para optimizar los parámetros. Mediante la optimización y el perfeccionamiento continuos, la estrategia espera obtener ganancias estables en el comercio real.
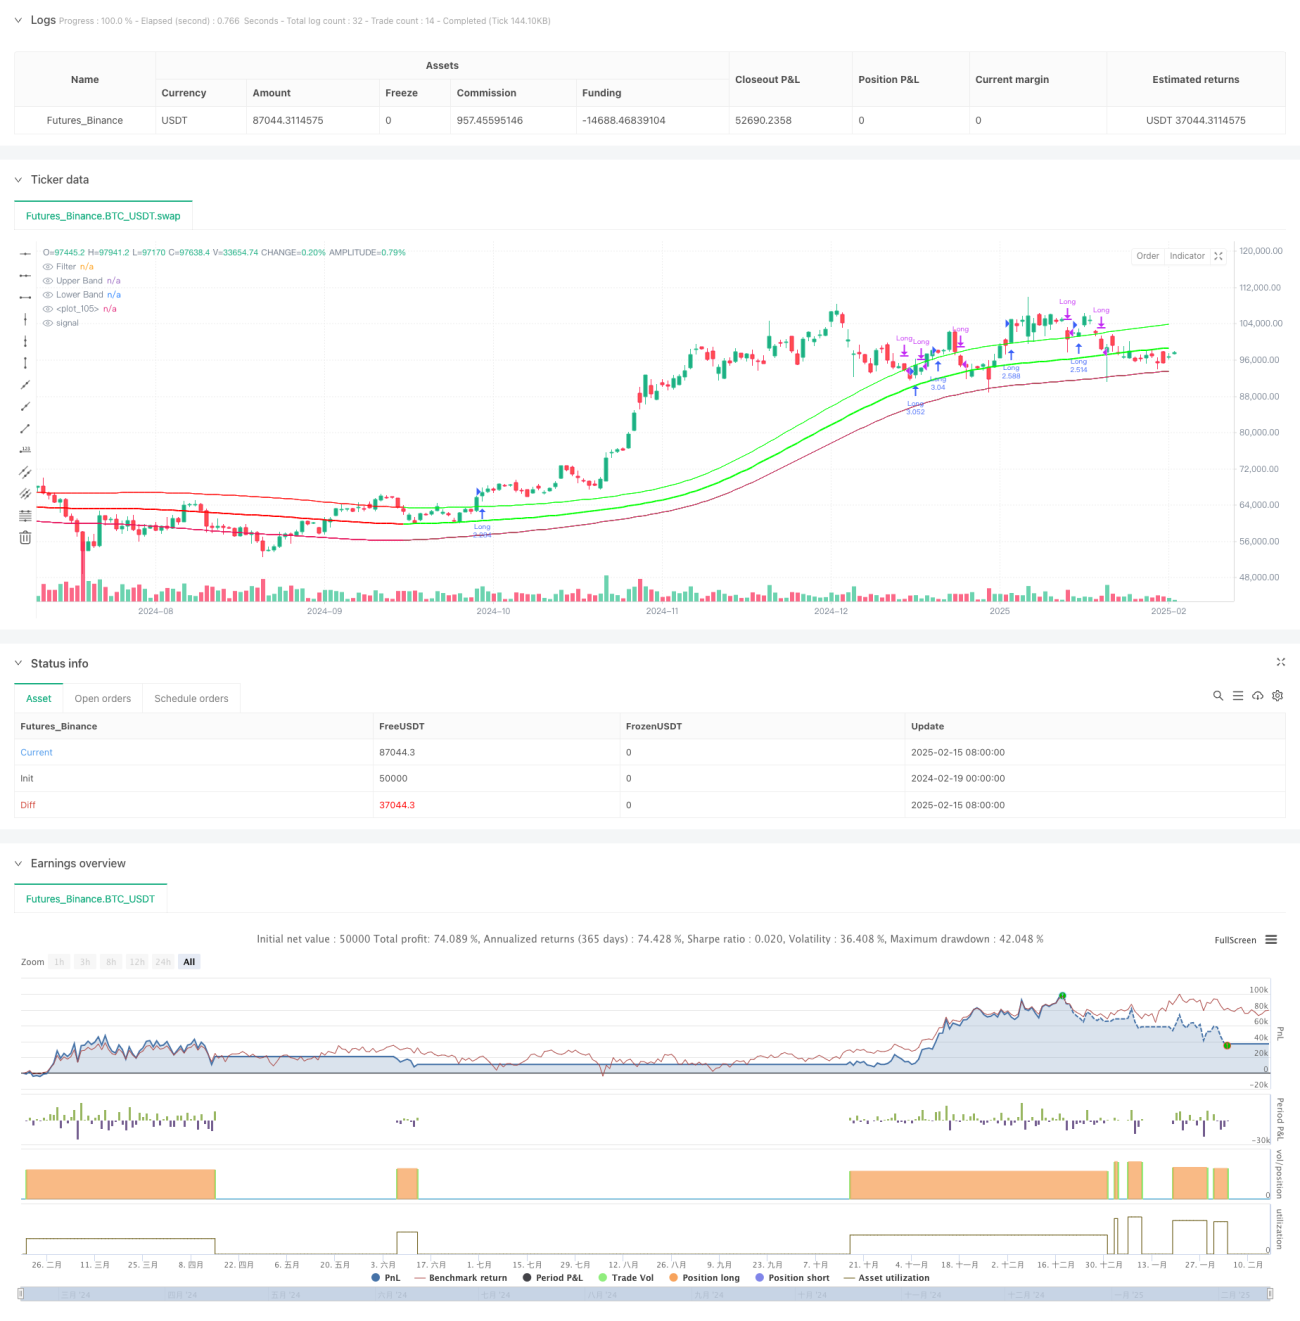
/*backtest
start: 2024-02-19 00:00:00
end: 2025-02-16 08:00:00
period: 1d
basePeriod: 1d
exchanges: [{"eid":"Futures_Binance","currency":"BTC_USDT"}]
*/

//@version=5
strategy(title="Demo GPT - Gaussian Channel Strategy v3.0", overlay=true, commission_type=strategy.commission.percent, commission_value=0.1, slippage=0, default_qty_type=strategy.percent_of_equity, default_qty_value=250)

// ============================================- 1