Descripción general
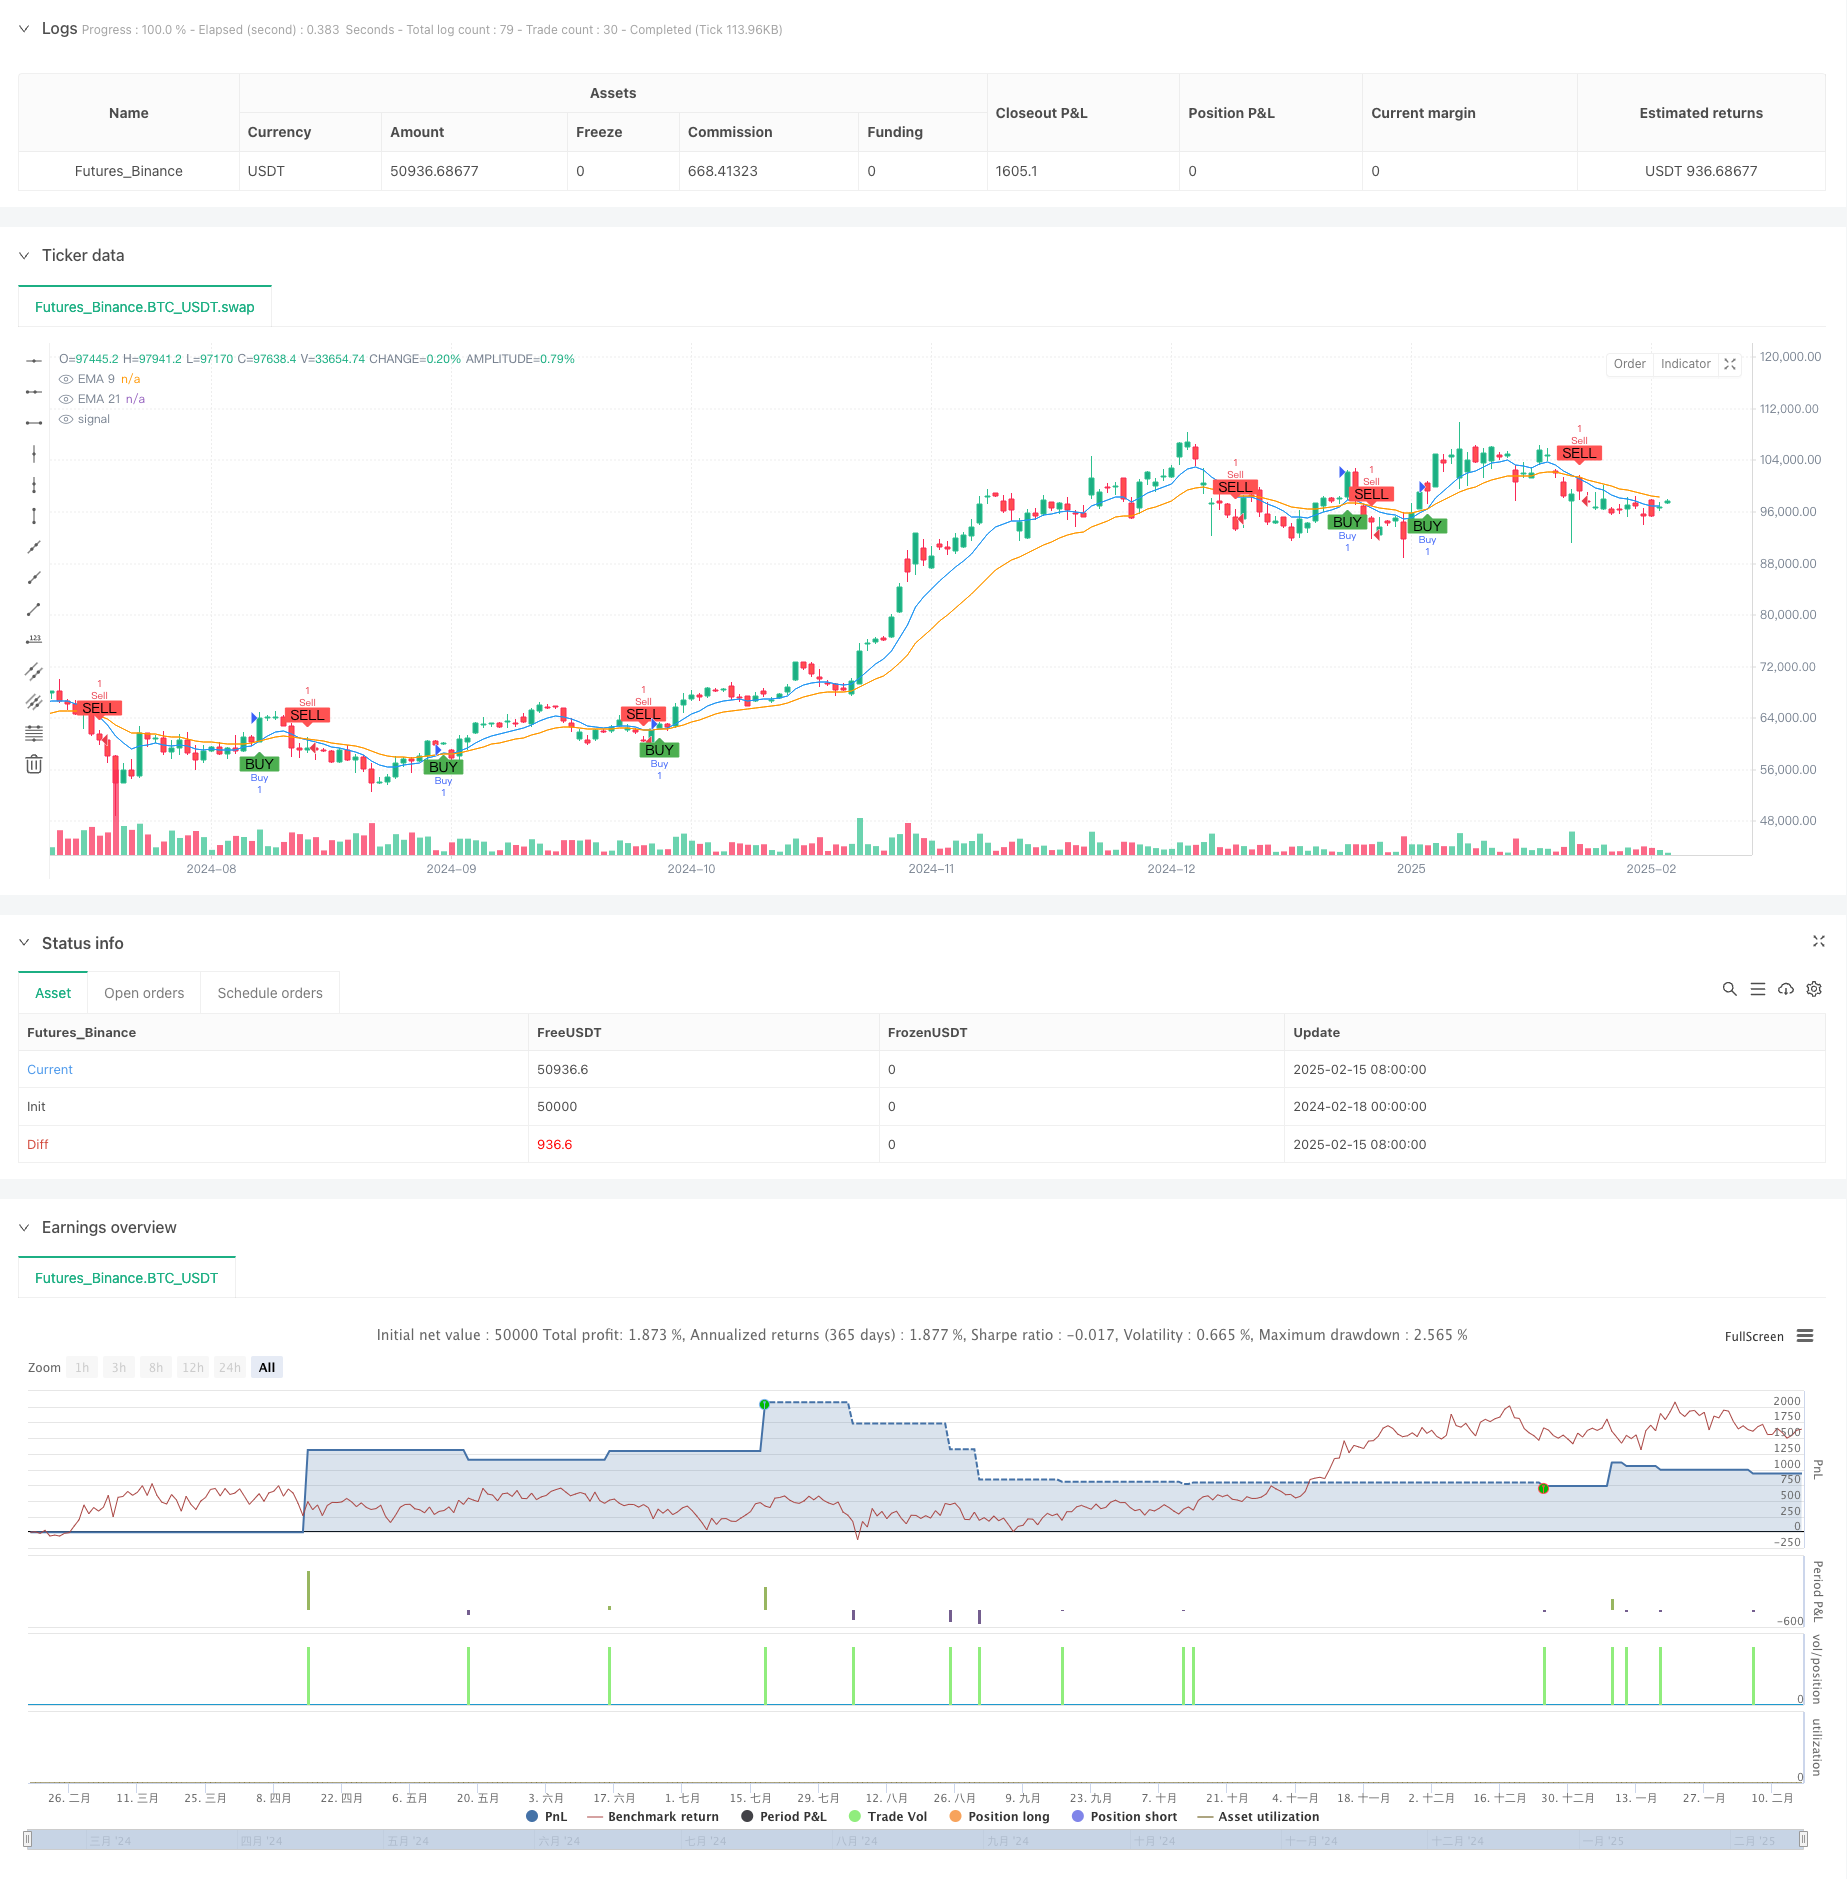
La estrategia es un sistema de negociación automático que combina el cruce de las medias móviles de índices (EMA) y el indicador relativamente débil (RSI). Identifica la dirección de la tendencia a través de la cruz de las líneas rápidas y lentas de EMA, mientras utiliza el RSI como indicador de confirmación de tendencia, y también incluye un completo mecanismo de gestión de fondos y control de riesgos. El sistema administra cada operación de manera fija con objetivos de riesgo y ganancias, y asegura la coherencia del riesgo mediante el cálculo dinámico del tamaño de la posición.
Principio de estrategia
La lógica central de la estrategia se basa en los siguientes elementos clave:
- El EMA de 9 y 21 períodos se utiliza para identificar los puntos de inflexión de la tendencia, el cruce de la línea lenta en la línea rápida representa el comienzo de una tendencia alcista, y el cruce de la línea baja representa el comienzo de una tendencia bajista
- El indicador RSI es una herramienta de confirmación de tendencias que requiere que el RSI sea >50 para una señal de compra y <50 para una señal de venta.
- El sistema de gestión de riesgos establece un máximo de pérdidas por transacción de 1000 y un objetivo de ganancias de 5000, para lograr un riesgo-beneficio fijo mediante el ajuste del tamaño de la posición
- El sistema utiliza una configuración de stop loss de un número fijo de puntos (de 25 puntos) y calcula el número de posiciones abiertas en función de la dinámica de la cantidad de riesgo
- El mecanismo de detección de fracasos de transacciones detecta en tiempo real las transacciones que se detienen y marcan los puntos de fracaso en el gráfico.
Ventajas estratégicas
- Mecanismo de doble verificación combinado con seguimiento de tendencias y confirmación de movimiento, mejora la fiabilidad de las señales de negociación
- Un buen sistema de gestión de fondos, el riesgo de cada transacción está fijado, evitando pérdidas excesivas
- Establecimiento de una clara relación riesgo-beneficio (RRB) de 1:5, que favorece la rentabilidad a largo plazo
- El sistema tiene la capacidad de realizar transacciones automáticamente, lo que reduce la interferencia emocional humana
- Marcas visuales de operaciones fallidas que ayudan a la optimización de estrategias y análisis de retroceso
Riesgo estratégico
- La estrategia de cruce de EMA puede generar falsas señales frecuentes en mercados convulsionados
- Los puntos fijos de pérdida pueden no ser lo suficientemente flexibles para adaptarse a cambios en la volatilidad
- Una mayor relación riesgo-beneficio (RRR) de 1: 5 puede conducir a una menor probabilidad de éxito.
- El RSI puede fallar en condiciones extremas de mercado
- El número fijo de transacciones puede no ser adecuado para todas las condiciones del mercado
Dirección de optimización de la estrategia
- Introducción de mecanismos de detención de pérdidas adaptativos, como el deterioro dinámico basado en ATR
- Aumentar los filtros de volatilidad del mercado y ajustar los parámetros de la estrategia durante la alta volatilidad
- Considerar la adición de indicadores de volumen de negocios como herramientas de confirmación auxiliares
- Desarrollo de mecanismos de ajuste dinámico de los relojes para adaptarse a las condiciones del mercado
- Introducción de más herramientas de reconocimiento de tendencias, como MACD o Brines
Resumir
La estrategia, combinada con EMA cruzada y RSI, construye un sistema de negociación completo que incluye elementos clave como la generación de señales, la gestión de riesgos y la ejecución de operaciones. Si bien hay algunos lugares que necesitan optimización, el diseño general del marco es razonable, especialmente en lo que respecta a la gestión de fondos.
/*backtest
start: 2024-02-18 00:00:00
end: 2025-02-16 08:00:00
period: 1d
basePeriod: 1d
exchanges: [{"eid":"Futures_Binance","currency":"BTC_USDT"}]
*/

// This Pine Script™ code is subject to the terms of the Mozilla Public License 2.0 at https://mozilla.org/MPL/2.0/
// © Lukhi24

//@version=6
strategy("Lukhi EMA Crossover_TWL Strategy" , overlay=true)

// Input Parameters
capital = 15000  // Capital: ₹15,000
risk_per_trade = 1000  // Risk per Trade: ₹1,000
target_per_trade = 5000  // Take Profit per Trade: ₹5,000
lot_size = input.int(1, title="Lot Size")  // Nifty option lot size (adjust as per your instrument)
stop_loss_distance = input.float(25, title="Stop Loss Distance (Points)")  // Fixed stop-loss in points (adjustable)

// EMA Parameters
short_ema_length = input.int(9, title="Short EMA Length")
long_ema_length = input.int(21, title="Long EMA Length")

// RSI Parameters
rsi_length = input.int(14, title="RSI Length")
rsi_overbought = input.float(70, title="RSI Overbought Level")
rsi_oversold = input.float(30, title="RSI Oversold Level")

// Calculations
ema_short = ta.ema(close, short_ema_length)
ema_long = ta.ema(close, long_ema_length)
rsi = ta.rsi(close, rsi_length)

// Buy and Sell Signals
buy_signal = ta.crossover(ema_short, ema_long) and rsi > 50
sell_signal = ta.crossunder(ema_short, ema_long) and rsi < 50

// Plot EMAs on the chart
plot(ema_short, color=color.blue, title="EMA 9")
plot(ema_long, color=color.orange, title="EMA 21")

// Risk Management: Position size based on stop-loss distance
position_size = risk_per_trade / stop_loss_distance

// Stop Loss and Take Profit Levels
long_stop_loss = close - stop_loss_distance
long_take_profit = close + (target_per_trade / position_size)

short_stop_loss = close + stop_loss_distance
short_take_profit = close - (target_per_trade / position_size)

// Strategy Logic: Entry, Stop Loss, and Take Profit
if (buy_signal)
    strategy.entry("Buy", strategy.long, qty=lot_size)
    strategy.exit("Exit Buy", "Buy", stop=long_stop_loss, limit=long_take_profit)

if (sell_signal)
    strategy.entry("Sell", strategy.short, qty=lot_size)
    strategy.exit("Exit Sell", "Sell", stop=short_stop_loss, limit=short_take_profit)

// Track Trade Result and Detect Failures
long_trade_loss = strategy.position_size > 0 and close <= long_stop_loss
short_trade_loss = strategy.position_size < 0 and close >= short_stop_loss

// Plot Buy and Sell signals on the chart
plotshape(buy_signal, location=location.belowbar, color=color.green, style=shape.labelup, title="Buy Signal", text="BUY")
plotshape(sell_signal, location=location.abovebar, color=color.red, style=shape.labeldown, title="Sell Signal", text="SELL")

// Plot Failure Signals
plotshape(long_trade_loss, location=location.belowbar, color=color.red, style=shape.cross, title="Long Trade Failed", text="Failed")
plotshape(short_trade_loss, location=location.abovebar, color=color.red, style=shape.cross, title="Short Trade Failed", text="Failed")