
La estrategia es un sistema de comercio cuantitativo basado en canales de regresión lineal y gráficos de Heinz-Ansch, combinado con un mecanismo de stop-loss dinámico, diseñado para aprovechar las oportunidades de rápida volatilidad en el mercado.
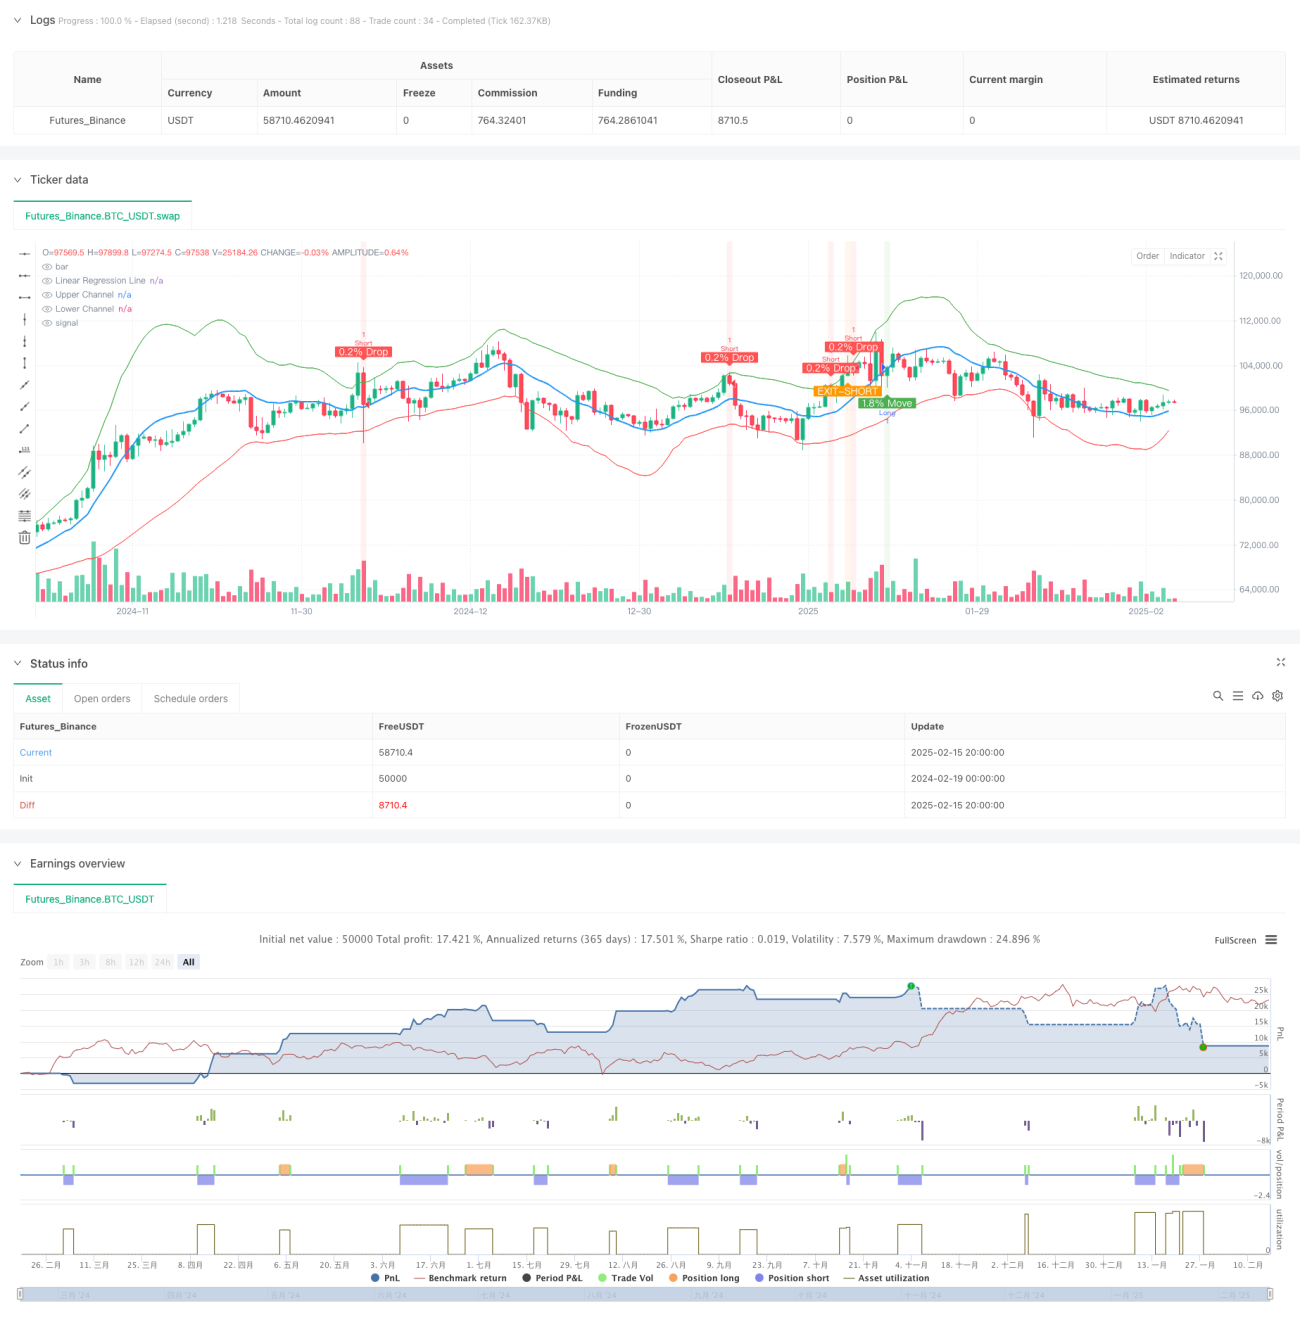
Esta estrategia utiliza el canal de regresión lineal como su marco principal de negociación para identificar oportunidades potenciales de negociación mediante la monitorización de la movilidad de los precios dentro del canal. Cuando los precios rompen el canal de descenso y tienen una subida de más del 1.8%, el sistema emite una señal múltiple; cuando los precios rompen el canal de descenso y tienen una subida de más del 0.2%, el sistema emite un vacío.
El núcleo de la estrategia se basa en un cálculo de regresión lineal de 30 ciclos, para establecer el ancho de la vía a través de 2 veces la diferencia estándar. La señal de entrada se basa en las siguientes condiciones:
La estrategia ofrece a los operadores un sistema de negociación relativamente completo a través de la combinación de un canal de regresión lineal y una ruptura de precio. Su ventaja es que combina varios indicadores técnicos y medidas de control de riesgo, pero aún así necesita ser optimizado y ajustado según las condiciones reales del mercado. Se recomienda realizar una adecuada retroalimentación y optimización de parámetros antes de la negociación en vivo.
/*backtest
start: 2024-02-19 00:00:00
end: 2025-02-16 08:00:00
period: 12h
basePeriod: 12h
exchanges: [{"eid":"Futures_Binance","currency":"BTC_USDT"}]
*/
//@version=6
strategy('STRATEGY WITH SL', overlay=true)
// Parameters for Linear Regression
length = input.int(30, title='Linear Regression Length')
mult = input.float(2.0, title='Channel Multiplier', step=0.1)
// Calculate Linear Regression
regression_line = ta.linreg(close, length, 0)
// Calculate Standard Deviation
stddev = ta.stdev(close, length)
// Upper and Lower Channel Boundaries
upper_channel = regression_line + mult * stddev
lower_channel = regression_line - mult * stddev
// Plot the Linear Regression and Channel
plot(regression_line, color=color.blue, linewidth=2, title='Linear Regression Line')
plot(upper_channel, color=color.green, linewidth=1, title='Upper Channel')
plot(lower_channel, color=color.red, linewidth=1, title='Lower Channel')
// Parameters for Price Move Check (Indicator 1: 1.8% Move)
threshold_move = 1.8
large_threshold_move = 5.0
timeframe_for_large_move = 120
// Calculate the percentage change over the last 3 minutes
priceChange = (close - close[3]) / close[3] * 100
// Calculate the percentage change over the last 2 hours (120 minutes)
priceChange2Hour = (close - close[120]) / close[120] * 100
// Condition for a price move greater than 1.8%
isPriceUp = priceChange > threshold_move
// Condition for price move greater than 5% in 2 hours (no alert if true)
isLargePriceMove = priceChange2Hour > large_threshold_move
// Parameters for Price Drop Check (Indicator 2: 0.2% Drop)
threshold_drop = 0.2 / 100 // 0.2% threshold
// Get the price 3 minutes ago
price_3min_ago = request.security(syminfo.tickerid, '3', close[1])
// Calculate the percentage drop over the last 3 minutes
price_drop = (close - price_3min_ago) / price_3min_ago
// Condition for a 0.2% drop
drop_condition = price_drop <= -threshold_drop
// Track whether the price has crossed the upper or lower Linear Regression channel
var bool lower_crossed = false
var bool upper_crossed = false
var bool move_after_cross = false
var bool alert_sent = false
// Reset flags when price crosses channels
if (close < lower_channel)
lower_crossed := true
move_after_cross := false
if (close > upper_channel)
upper_crossed := true
alert_sent := false
// Combine both conditions for price crossing lower and upper channels and move/drop conditions
final_condition_long = lower_crossed and isPriceUp and not move_after_cross and not isLargePriceMove
final_condition_short = upper_crossed and drop_condition and not alert_sent
// Set flags when conditions are met
if (final_condition_long)
move_after_cross := true
if (final_condition_short)
alert_sent := true
// Heikin-Ashi calculation for dynamic timeframe (3-minute)
heikin_open = (open + close) / 2
heikin_close = (open + high + low + close) / 4
heikin_high = math.max(high, math.max(heikin_open, heikin_close))
heikin_low = math.min(low, math.min(heikin_open, heikin_close))
// Conditions for EXIT signals based on Heikin-Ashi candle body
exit_long_condition = (heikin_open > lower_channel and heikin_close < lower_channel) or (heikin_open < lower_channel and heikin_close > lower_channel)
exit_short_condition = heikin_open < upper_channel and heikin_close > upper_channel
// Strategy logic: Enter long or short based on the combined conditions
// Long Entry Condition
if (final_condition_long)
strategy.entry('Long', strategy.long)
// Short Entry Condition
if (final_condition_short)
strategy.entry('Short', strategy.short)
// Exit Conditions (EXIT-LONG and EXIT-SHORT)
if (exit_long_condition)
strategy.close('Long')
if (exit_short_condition)
strategy.close('Short')
// Take Profit and Stop Loss
take_profit = 10 / 100 // 10% Take Profit
stop_loss = 5 / 100 // 5% Stop Loss
// Calculate Take Profit and Stop Loss levels based on entry price
long_take_profit = strategy.position_avg_price * (1 + take_profit)
long_stop_loss = strategy.position_avg_price * (1 - stop_loss)
short_take_profit = strategy.position_avg_price * (1 - take_profit)
short_stop_loss = strategy.position_avg_price * (1 + stop_loss)
// Apply Take Profit and Stop Loss for Long and Short positions
strategy.exit('Take Profit/Stop Loss Long', from_entry='Long', limit=long_take_profit, stop=long_stop_loss)
strategy.exit('Take Profit/Stop Loss Short', from_entry='Short', limit=short_take_profit, stop=short_stop_loss)
// Plot background color when the conditions are met (for visual aid)
bgcolor(final_condition_long ? color.new(color.green, 90) : na, title='Price Move Alert After Lower Channel Crossed')
bgcolor(final_condition_short ? color.new(color.red, 90) : na, title='Price Drop Alert After Upper Channel Crossed')
bgcolor(exit_long_condition ? color.new(color.blue, 90) : na, title='EXIT-LONG Alert')
bgcolor(exit_short_condition ? color.new(color.orange, 90) : na, title='EXIT-SHORT Alert')
// Plot shapes when conditions are met
plotshape(final_condition_long, style=shape.labelup, location=location.belowbar, color=color.green, text='1.8% Move', textcolor=color.white, size=size.small)
plotshape(final_condition_short, style=shape.labeldown, location=location.abovebar, color=color.red, text='0.2% Drop', textcolor=color.white, size=size.small)
plotshape(exit_long_condition, style=shape.labeldown, location=location.abovebar, color=color.purple, text='EXIT-LONG', textcolor=color.white, size=size.small)
plotshape(exit_short_condition, style=shape.labelup, location=location.belowbar, color=color.orange, text='EXIT-SHORT', textcolor=color.white, size=size.small)
// Alert conditions for price moves and exits
alertcondition(final_condition_long, title="Price Move > 1.8% After Lower LR Channel Cross", message="Price crossed the lower Linear Regression Channel and moved more than 1.8% in the last 3 minutes!")
alertcondition(final_condition_short, title="Price Drop > 0.2% After Upper LR Channel Cross", message="Price crossed the upper Linear Regression Channel and dropped more than 0.2% in the last 3 minutes!")
alertcondition(exit_long_condition, title="EXIT-LONG: Heikin-Ashi Candle Body Crossing Lower LR Channel", message="The body of a 3-minute Heikin-Ashi candle is crossing outside the lower Linear Regression Channel.")
alertcondition(exit_short_condition, title="EXIT-SHORT: Heikin-Ashi Candle Body Crossing Upper LR Channel", message="The body of a 3-minute Heikin-Ashi candle is crossing outside the upper Linear Regression Channel.")