Estrategia comercial de seguimiento de tendencias adaptativo dinámico cruzado con múltiples indicadores

Descripción general
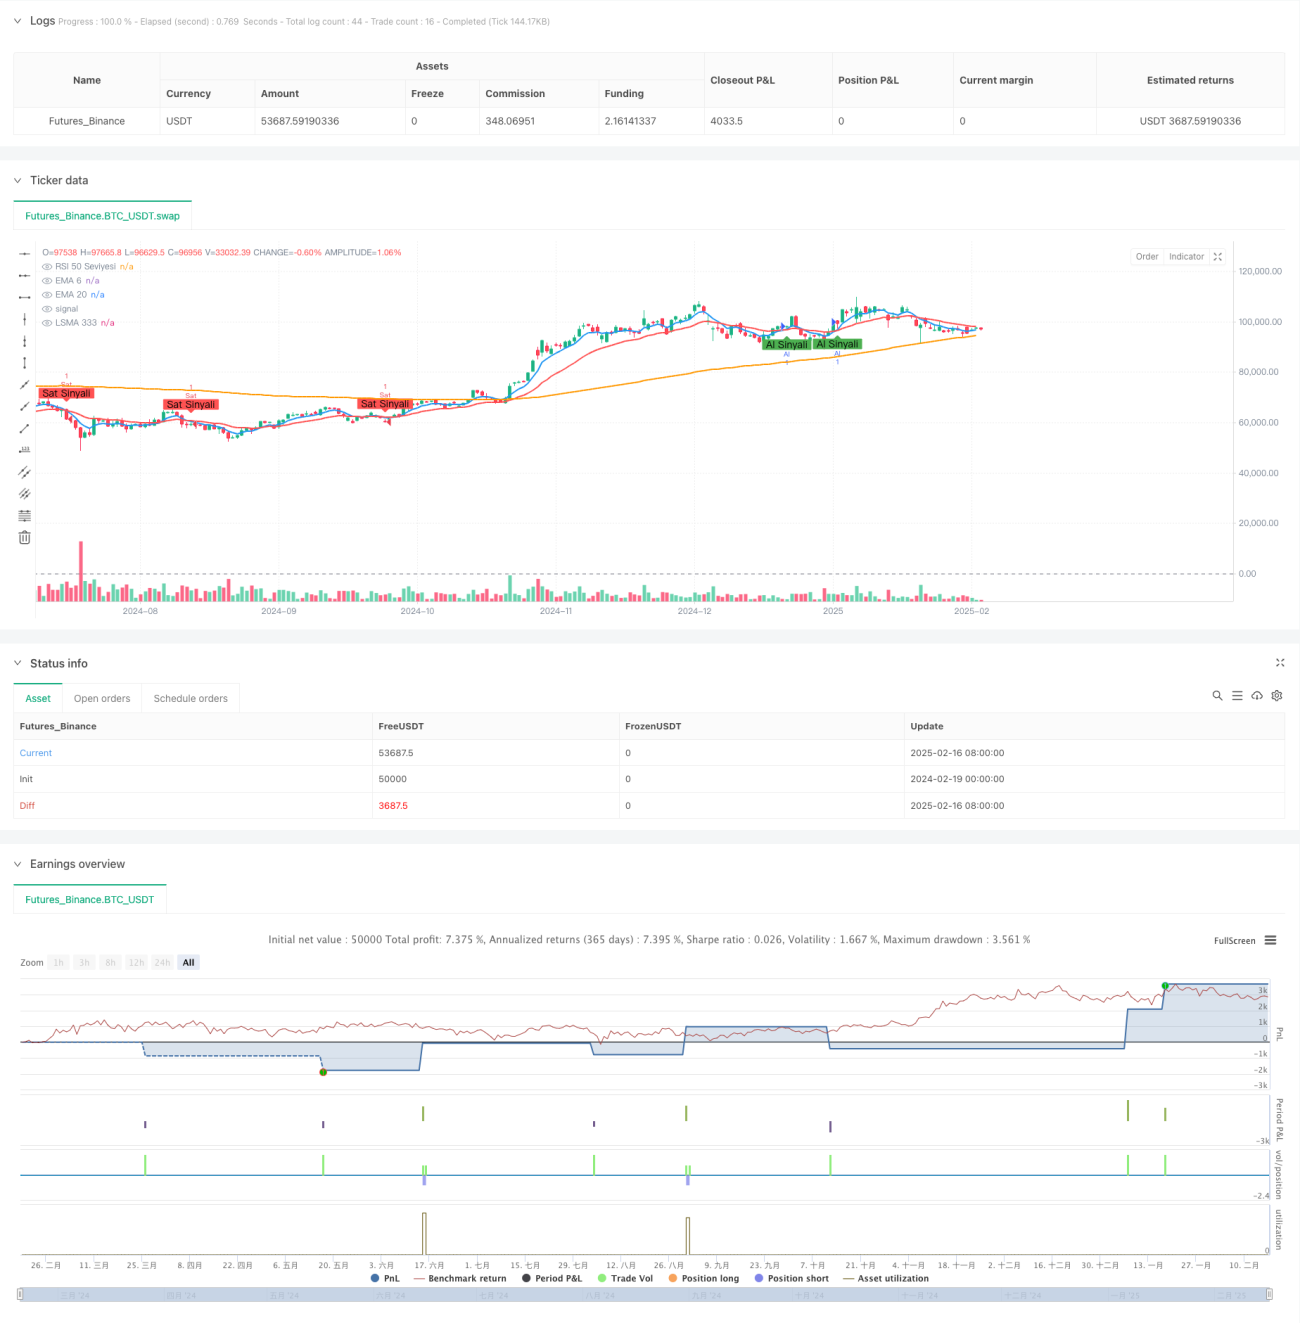
La estrategia es un sistema de seguimiento de tendencias basado en el cruce de múltiples indicadores técnicos, que combina los tres indicadores EMA (medios móviles del índice), LSMA (medios móviles mínimos de dos veces) y RSI (indicadores relativamente fuertes) para filtrar las oportunidades de negociación a través de la confirmación de múltiples señales. La estrategia utiliza un mecanismo de stop-loss adaptativo que puede ajustar los parámetros de gestión de riesgo según la dinámica del mercado.
Principio de estrategia
La lógica central de la estrategia incluye los siguientes aspectos:
- Utiliza el EMA de corto período (6) y largo período (20) para capturar el punto de inflexión de la tendencia
- El uso de LSMA ((333) como indicador de confirmación de tendencias a largo plazo
- La línea de separación de 50 del RSI ((14) como un criterio para determinar la fortaleza del mercado
- La opción de abrir más posiciones si se cumplen las siguientes condiciones:
- El EMA6 lleva el EMA20
- El precio está por encima de LSMA333.
- El RSI es mayor que 50.
- La apertura de una posición vacía si se cumplen las siguientes condiciones:
- EMA 6 bajo el EMA 20
- El precio está por debajo de LSMA333.
- El RSI es menor a 50.
Ventajas estratégicas
- Confirmación cruzada de múltiples indicadores reduce considerablemente el impacto de las falsas señales
- La combinación de seguimiento de tendencias y indicadores de dinámica mejora la fiabilidad de la señal
- Un mecanismo de parada y pérdida adaptativo, que se puede ajustar de forma flexible a las condiciones del mercado
- La lógica de la estrategia es clara y los parámetros son altamente ajustables.
- El análisis multidimensional del mercado mejora la probabilidad de éxito de las transacciones
Riesgo estratégico
- En mercados volátiles pueden producirse señales falsas frecuentes
- Múltiples indicadores pueden confirmar que el momento de entrada está ligeramente retrasado
- Los stop-loss y take-profit de porcentaje fijo pueden no ser adecuados para todas las condiciones del mercado
- La optimización excesiva de parámetros puede provocar un sobreajuste
- En un mercado rápido, puede que se pierdan algunas de las oportunidades de negocio.
Dirección de optimización de la estrategia
- Introducción de un indicador de fluctuación para ajustar dinámicamente el índice de stop loss
- Aumentar el análisis del volumen de transacciones para confirmar la efectividad de las tendencias
- Considerar la adición de un sistema de clasificación de entornos de mercado que utilice diferentes parámetros en diferentes condiciones de mercado
- Mecanismo de adaptación para optimizar los parámetros del indicador
- Aumentar el sistema de gestión de posiciones para un control de posición más flexible
Resumir
La estrategia utiliza múltiples indicadores técnicos para construir un sistema de seguimiento de tendencias relativamente sólido. La principal ventaja de la estrategia es la fiabilidad de la confirmación de señales, pero también se debe tener en cuenta la adaptabilidad en diferentes entornos de mercado. A través de la optimización y mejora continuas, la estrategia tiene la posibilidad de obtener mejores resultados en el comercio real.
- 1