
Descripción general
Se trata de una estrategia de negociación de varios períodos de tiempo basada en la teoría de la brecha de la brecha. La estrategia identifica oportunidades potenciales de negociación principalmente a través del análisis de las formas de la brecha y los rangos de precios en períodos de tiempo más altos. La estrategia integra un filtro de volumen de transacción y un mecanismo de stop loss dinámico para capturar oportunidades de tendencia a través de brechas en los altos y bajos anteriores.
Principio de estrategia
El núcleo de la estrategia es monitorear los periodos de tiempo más altos (de 4 horas por defecto) en los que los precios superan los rangos anteriores. En concreto:
- La estrategia sigue y almacena datos de los puntos altos y bajos de las dos líneas K de los períodos de tiempo altos anteriores
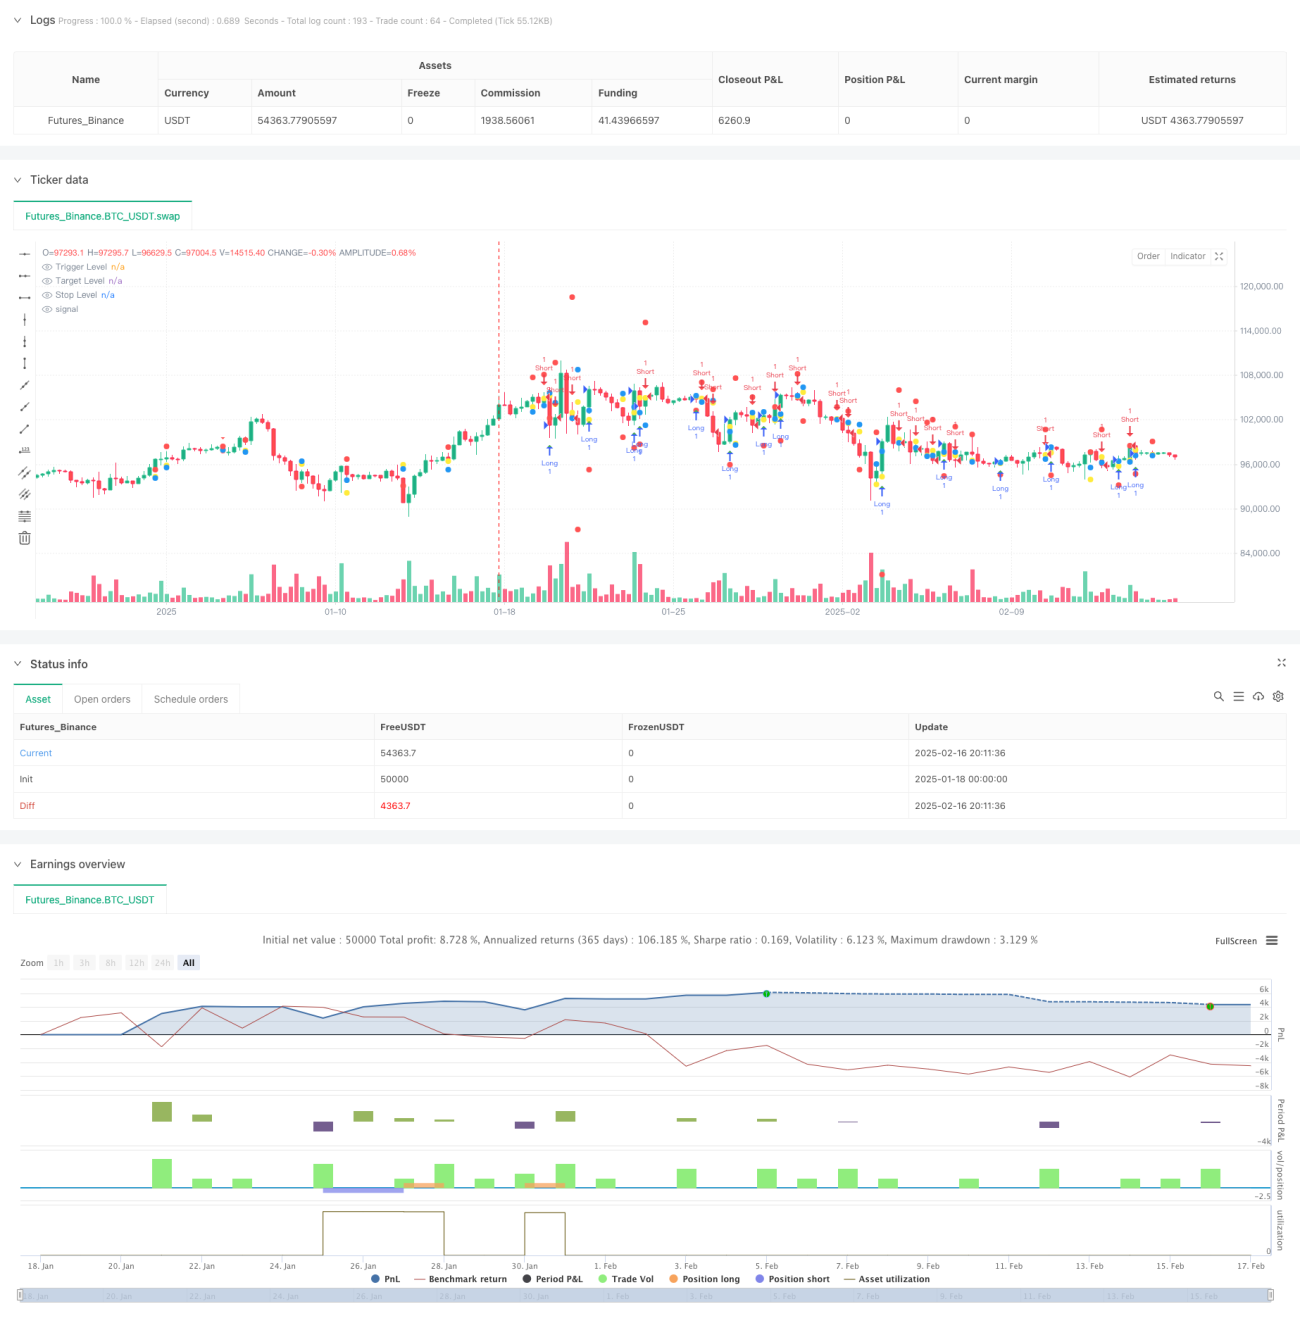
- Cuando el precio de cierre de una línea K actual está por debajo del precio de cierre anterior y el precio de la línea K actual es alto, se forma una señal de corto plazo
- Cuando el precio de cierre de una línea K actual es más alto que el precio de cierre de una línea K anterior y la innovación de la línea K actual es baja, se forma una señal múltiple
- El precio de entrada se fija en la posición de los puntos altos y bajos que desencadenan la línea K
- El objetivo de ganancias se establece en la posición de los puntos altos y bajos correspondientes en el período anterior
- La distancia de parada se ajusta dinámicamente según el tamaño del intervalo
Ventajas estratégicas
- El análisis de múltiples períodos de tiempo ofrece una señal más confiable
- Paradas dinámicas de pérdidas que se ajustan a la volatilidad del mercado
- Mecanismos de filtración de volumen de transacciones opcionales para aumentar la confirmación de las transacciones
- Interfaces visuales claros, incluidos marcadores de precios de inicio, precios de meta y precios de parada
- La lógica de la estrategia es simple, clara, fácil de entender y ejecutar
- Aplicable a todo tipo de transacciones y entornos de mercado
Riesgo estratégico
- Las frecuentes falsas brechas en los mercados convulsionados pueden generar
- Un mayor multiplicador de stop loss puede causar una pérdida excesiva en una sola operación
- Depende de datos históricos de precios y puede reaccionar con retraso en un entorno de mercado que cambia rápidamente
- No se tiene en cuenta el impacto de los factores fundamentales
- Puede ser difícil de ejecutar con eficacia en mercados con poca liquidez
Dirección de optimización de la estrategia
- Introducir filtros de tendencia, como las medias móviles o el indicador ADX
- Añadir más criterios de evaluación del entorno del mercado
- Optimización de las estrategias de stop loss y la posibilidad de introducir stop loss móvil
- Unirse al módulo de gestión de volumen de transacciones
- Considere agregar más análisis de combinación de períodos de tiempo
- Introducción de indicadores de fluctuación para optimizar el juicio intervalo
Resumir
Se trata de una estrategia de negociación multi-ciclo de tiempo estructurada, con claridad lógica. Se buscan oportunidades de tendencia potenciales mediante el análisis del comportamiento de los precios en ciclos de tiempo más altos, mientras que se integra la gestión de riesgos y el mecanismo de filtración.
- 1