Estrategia de trading con seguimiento de tendencia de media móvil de volumen dinámico y ruptura HLCC4

Descripción general
La estrategia es un sistema de seguimiento de tendencias basado en múltiples períodos de tiempo, que combina el promedio móvil ponderado por volumen de transacción de 50 períodos circundantes (VWMA) como filtro de tendencia mayor y utiliza los brechas de precio de 200 períodos VWMA y HLCC4 del ciclo de tiempo actual como señal de negociación específica. Es una estrategia de hacer más que solo, para mejorar la fiabilidad de las operaciones mediante la confirmación de tendencias rigurosas y la verificación de múltiples períodos de tiempo.
Principio de estrategia
La lógica central de la estrategia incluye los siguientes elementos clave:
- Utilizando el VWMA de 50 períodos de la línea de circunvalación como criterio para determinar la tendencia mayor, solo se permite abrir una posición cuando el precio está por encima de esta línea media.
- Los requisitos de entrada requieren que ambos precios de cierre de línea K consecutivos estén por encima de la VWMA de 200 períodos, y que el precio de cierre de la segunda línea K sea superior al promedio HLCC4 de la primera línea K.
- La señal de salida se basa en el nivel de la línea diaria, y el cierre de la línea diaria se cierra cuando el precio cae por debajo de la línea diaria de 200 ciclos VWMA.
- La estrategia utiliza un método de gestión de posiciones fijas, en el que el 10% de los intereses de la cuenta se utiliza en cada transacción.
- El plazo semanal de retroceso en los últimos 5 años asegura la eficacia de la estrategia en el entorno de mercado reciente.
Ventajas estratégicas
- Verificación de múltiples períodos de tiempo: la combinación de la línea de la órbita y la línea del sol permite comprender las tendencias generales y responder a los cambios en el mercado a tiempo.
- Control de riesgos: el uso de VWMA en lugar de las medias móviles simples refleja mejor la tendencia real del mercado.
- La rigurosidad de la confirmación de tendencias: requiere que se cumplan múltiples condiciones para entrar, lo que reduce el riesgo de falsas brechas.
- La administración de posiciones es razonable: la administración de posiciones de proporción fija controla el riesgo y mantiene el margen de ganancias.
- Alto grado de automatización: La lógica de la estrategia es clara y se puede automatizar completamente las transacciones.
Riesgo estratégico
- Riesgo de reversión de la tendencia: en un momento de fuerte volatilidad en el mercado, es posible que se produzca una reversión mayor.
- Efectos de los puntos de deslizamiento: los precios reales de las transacciones pueden estar desviados de los precios teóricos cuando el mercado no es muy líquido.
- Signo de retraso: debido a que se utiliza una línea media de un período más largo, la estrategia puede tener un retraso en la respuesta a los puntos de cambio de tendencia.
- Riesgo de falsa brecha: A pesar de la confirmación múltiple, es posible que se produzcan pérdidas por falsa brecha.
- Limitación de la negociación unidireccional: la estrategia consiste en hacer más y perder oportunidades potenciales de desvalorización en una tendencia a la baja.
Dirección de optimización de la estrategia
- Optimización de parámetros dinámicos: los parámetros de ciclo de VWMA se pueden ajustar automáticamente según la volatilidad del mercado.
- Optimización de la gestión de posiciones: introducción de un sistema de gestión de posiciones dinámico basado en la volatilidad.
- Mejoras en el mecanismo de salida: se puede agregar un stop móvil o un stop dinámico basado en indicadores técnicos.
- Aumentar los indicadores de sentimiento del mercado: en combinación con indicadores como el RSI o el MACD para mejorar la fiabilidad de la señal.
- Introducción al análisis del volumen de transacciones: profundizar en el análisis del volumen de transacciones y optimizar los métodos de cálculo de VWMA.
Resumir
Se trata de una estrategia de seguimiento de tendencias rigurosa, diseñada para lograr un mejor control del riesgo a través de la combinación de múltiples períodos de tiempo y condiciones de negociación estrictas. La ventaja central de la estrategia reside en su mecanismo de confirmación de tendencias perfectamente desarrollado y su lógica de negociación clara, adecuada para aprovechar las oportunidades de tendencia a medio y largo plazo en mercados fuertes.
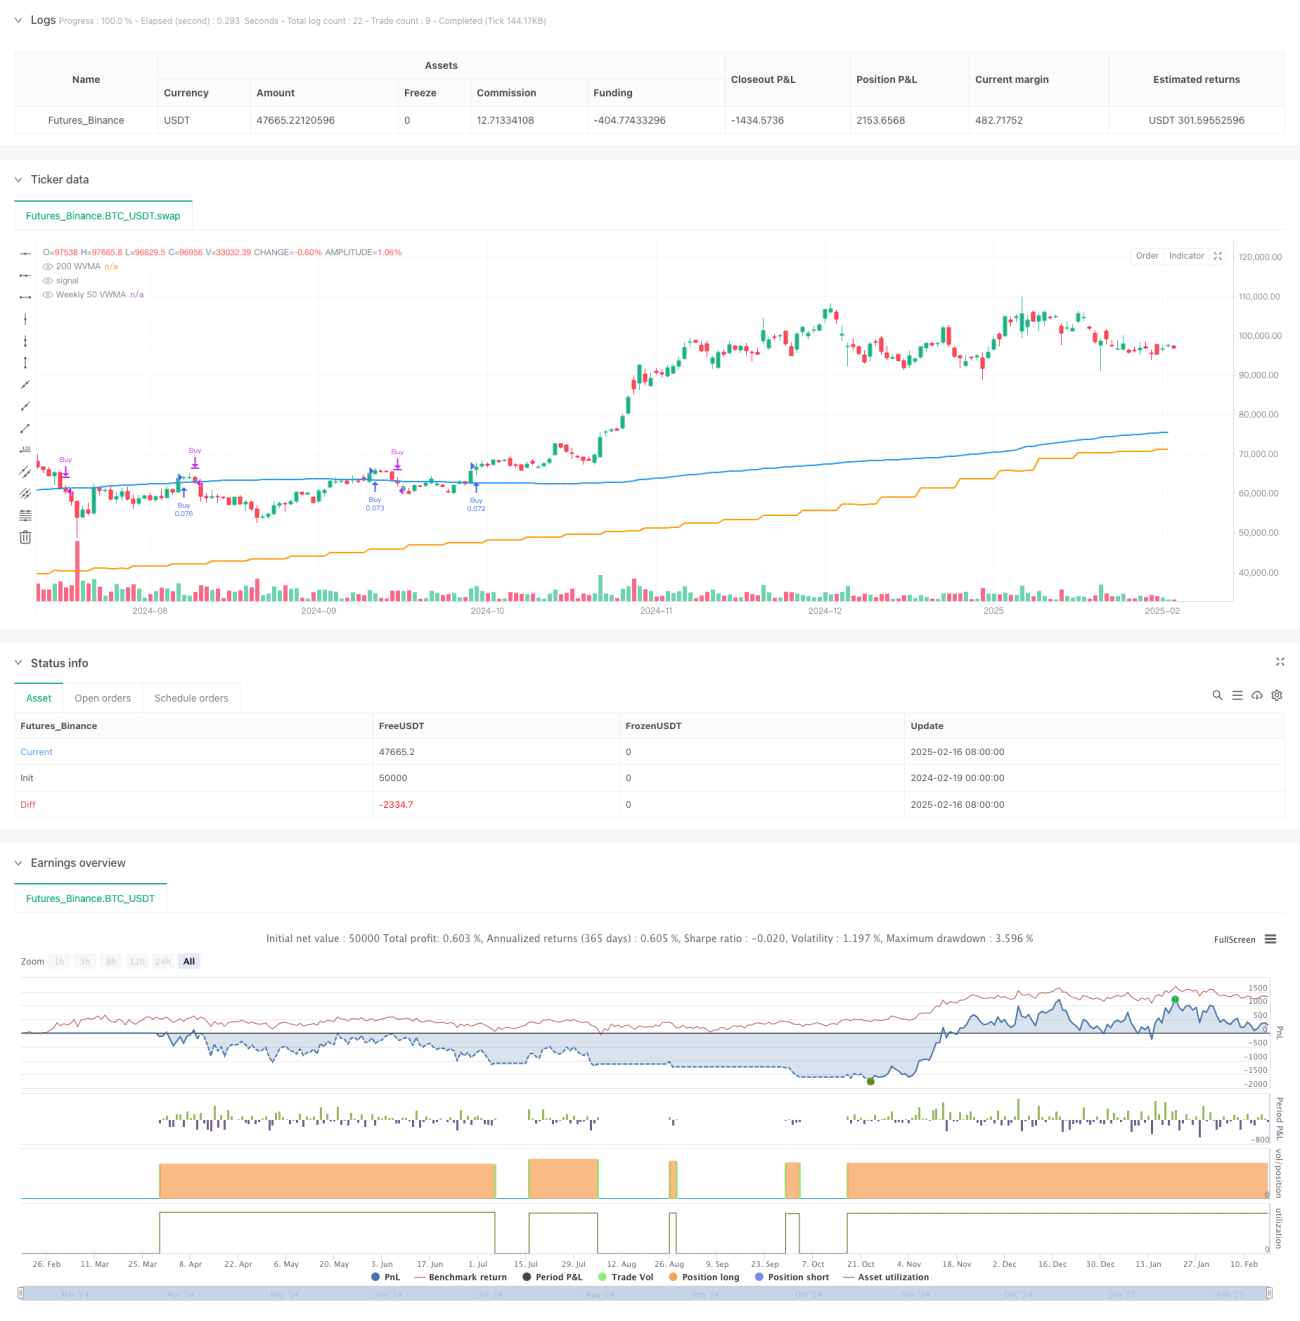
/*backtest
start: 2024-02-19 00:00:00
end: 2025-02-17 00:00:00
period: 1d
basePeriod: 1d
exchanges: [{"eid":"Futures_Binance","currency":"BTC_USDT"}]
*/

//@version=6
strategy("Long-Only 200 WVMA + HLCC4 Strategy (Weekly 50 VWMA Filter, Daily Exit, Last 5 Years)", overlay=true, default_qty_type=strategy.percent_of_equity, default_qty_value=10)

// Parameters- 1