
Descripción general
La estrategia es un sistema de trading de seguimiento de tendencias basado en las formas de brechas de la banda de Brin y de la línea de anclaje. La estrategia identifica las líneas de anclaje mediante la identificación de tres brechas consecutivas de la banda de Brin y la combinación de la posición del precio de cierre en la entidad de la línea de anclaje para determinar la señal de negociación. El sistema utiliza una relación de riesgo-beneficio fija de 1:1 para administrar las paradas y paradas de cada operación.
Principio de estrategia
La lógica central de la estrategia se basa en los siguientes elementos clave:
- Utilizando el cinturón de Bryn de 20 ciclos como indicador principal, el factor de diferencia estándar es de 2.0
- Condición de entrada múltiple: tres líneas K consecutivas de cierre cerrado quebraron la vía, y las tres líneas K son líneas dianas, y el cierre cerrado está en la mitad superior de la entidad
- Condiciones de entrada sin cabeza: tres líneas K consecutivas de cierre de precios se desviaron, y las tres líneas K son negativas, y el cierre de precios se encuentra en la mitad inferior de la entidad
- La parada de pérdidas se establece en el límite de la línea K de la primera señal.
- El riesgo-beneficio basado en 1:1 para establecer una posición de parada
Ventajas estratégicas
- El uso de un mecanismo de confirmación múltiple, que reduce el riesgo de falsas brechas mediante el requisito de forma de tres brechas consecutivas de la línea K.
- Combinado con la ubicación de los precios de cierre en la entidad de la línea K, aumenta la fiabilidad de la confirmación de tendencias
- La administración de posiciones con una relación de riesgo-beneficio fija facilita el control del riesgo
- La lógica de la estrategia es clara, fácil de entender e implementar.
- Indicación de señales de negociación para facilitar el análisis de retroceso mediante la función de marcado
Riesgo estratégico
- En mercados volátiles pueden producirse señales falsas frecuentes
- El riesgo-beneficio fijo puede no ser suficiente para captar las tendencias fuertes
- El estricto requisito de tres líneas K consecutivas puede perder algunas oportunidades potenciales
- El punto de parada está situado en el límite de la línea K de la señal, que puede estar demasiado lejos en caso de grandes fluctuaciones.
Se recomienda administrar el riesgo de la siguiente manera:
- Ajuste de los parámetros de las bandas de Bryn en combinación con las fluctuaciones del mercado
- Ajuste de riesgo/beneficio en función de las características del mercado
- Añadir indicadores de confirmación de tendencias
- Optimización de los métodos de configuración de la posición de parada
Dirección de optimización de la estrategia
- Optimización de parámetros:
- Se puede ajustar el ciclo de la banda de Bryn y el múltiplo de la diferencia estándar según la dinámica de las diferentes características del mercado
- Considere la posibilidad de cambiar la demanda de las tres líneas K a un juicio dinámico.
- Optimización de señal:
- Aumentar los indicadores de confirmación de tendencias como el ADX o las líneas de tendencia
- Introducción de un mecanismo de confirmación de las entregas
- Considere la inclusión de un indicador de oscilación como ayuda
- Optimización de la gestión de posiciones:
- Establecimiento de la relación riesgo-beneficio para lograr una dinámica
- Añadir un módulo de gestión de fondos
- Considerar el mecanismo de construcción de almacenes por lotes y por paz
- Optimización de pérdidas:
- Introducción de un mecanismo de seguimiento de pérdidas
- Distancia de pérdida basada en la configuración ATR
- Considere el tiempo perdido
Resumir
Esta es una estrategia de seguimiento de tendencias estructurada y con claridad lógica. El mecanismo de confirmación múltiple de las rupturas de la banda de Brin y las formas de las líneas de derivación reduce el riesgo de falsas señales. La configuración fija de la relación de riesgo y ganancia simplifica la administración de operaciones, pero también limita la flexibilidad de la estrategia.
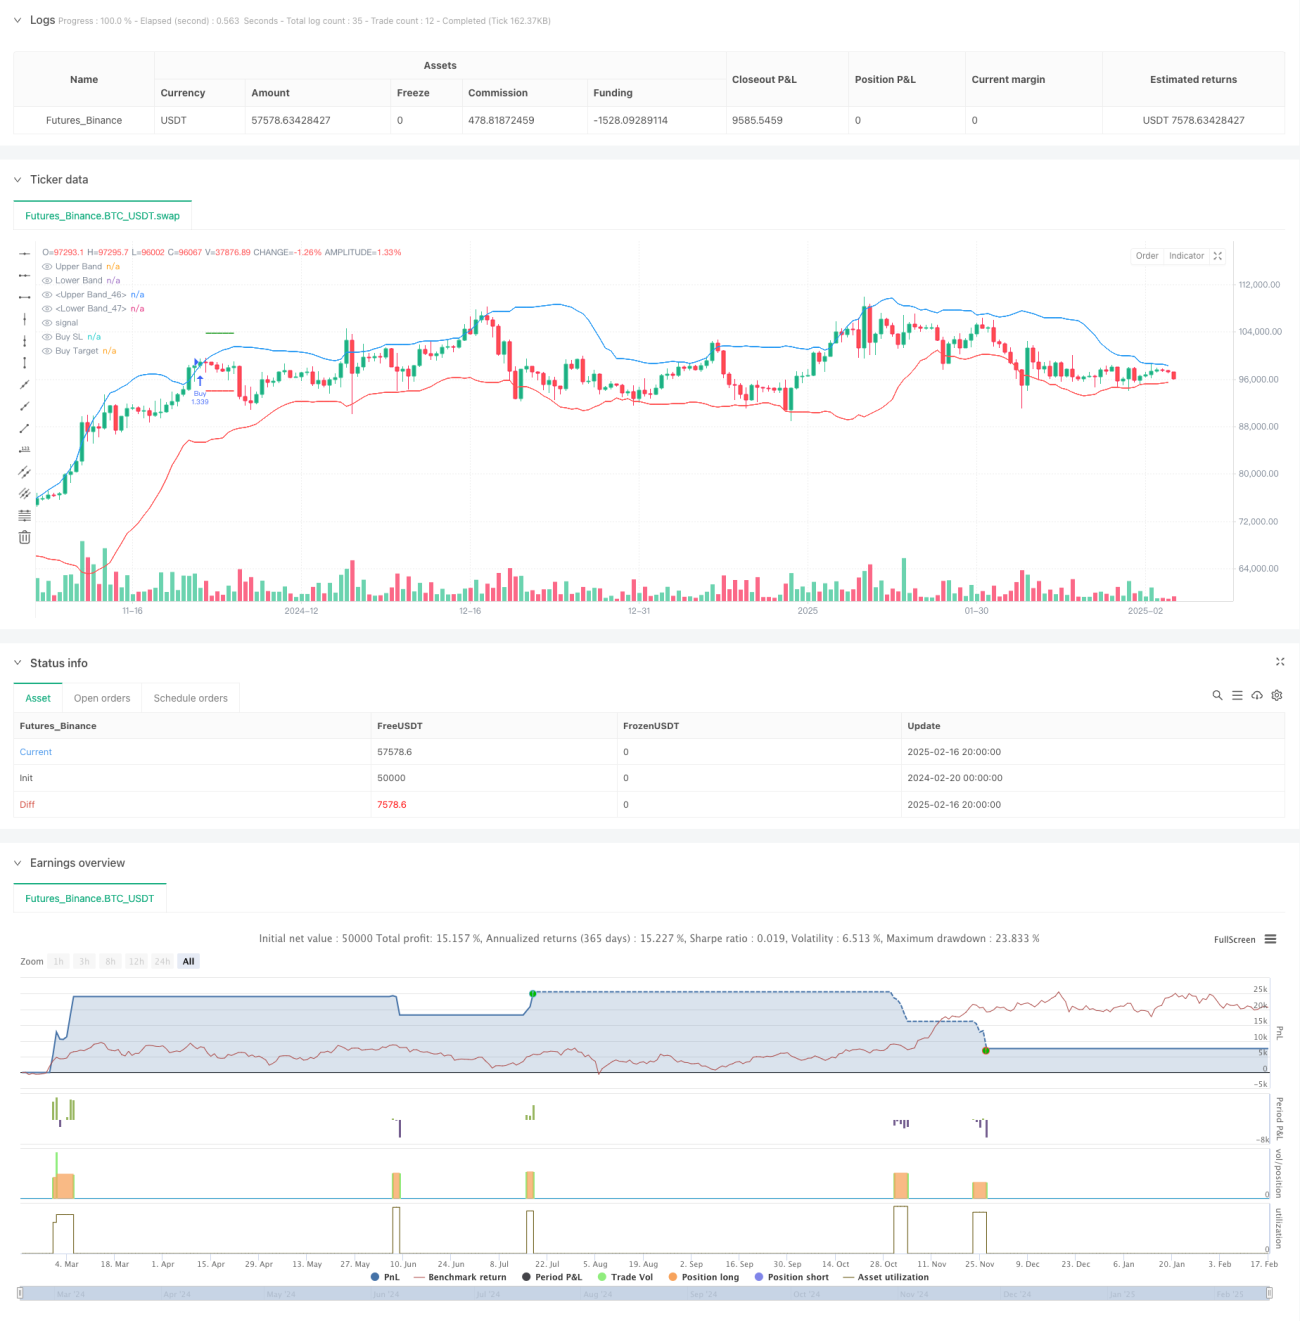
/*backtest
start: 2024-02-20 00:00:00
end: 2025-02-17 08:00:00
period: 12h
basePeriod: 12h
exchanges: [{"eid":"Futures_Binance","currency":"BTC_USDT"}]
*/

//@version=6
strategy("Bollinger Band Strategy (Close Near High/Low Relative to Half Range)", overlay=true, default_qty_type=strategy.percent_of_equity, default_qty_value=200, pyramiding=0)

// Bollinger Bands- 1